Hi I am trying to display Relative Strength (RS) along with Price. Just like we get in IBD.
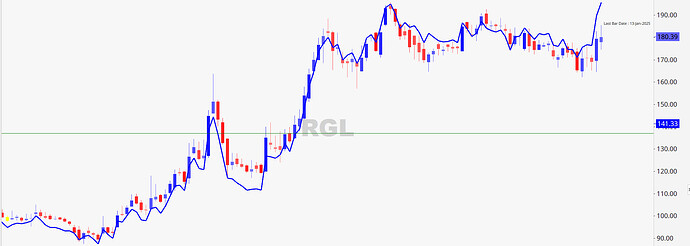
However, struggling with the same. This is what I get when I try to put RS Indicator over price.
I Need RS to be below Price. But somehow it isn’t showing up correctly.
Hi,
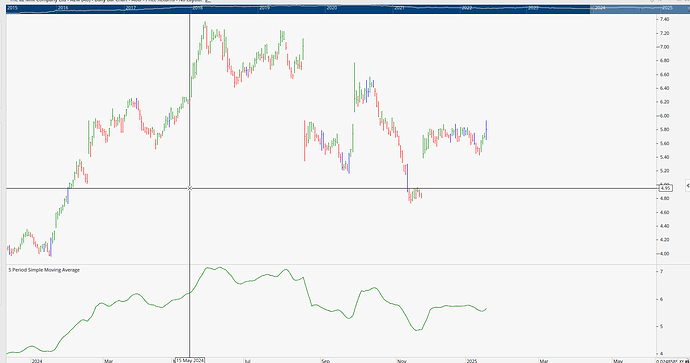
If I understand you correctly, you are looking to put the relative strength on its own axis down the bottom of your chart window, similar to where the MA is in this image?
You can achieve that in two ways for custom tools. Either:
- click and hold on the tool and then drag it down to the bottom of your screen. Some squiggly lines should show up and the tooltip will say drop to ‘add new view’.
- When you are setting up the tool in the scipt editor, next to where you have the tick box for use as indicator, there is a drop down box which allows you to automatically put it in a new view when it is added to a chart.
If this is not what you are looking for, then maybe you can provide a sceeenshot from IBD to show exactly what you are looking for.
Thanks for your reply. Please find attached the chart below. Look at how RS Line is below the price. This is what I want. Can’t figure out how to do this without distorting how RS line will look as both Price & RS have different scale.
Hi Manisha,
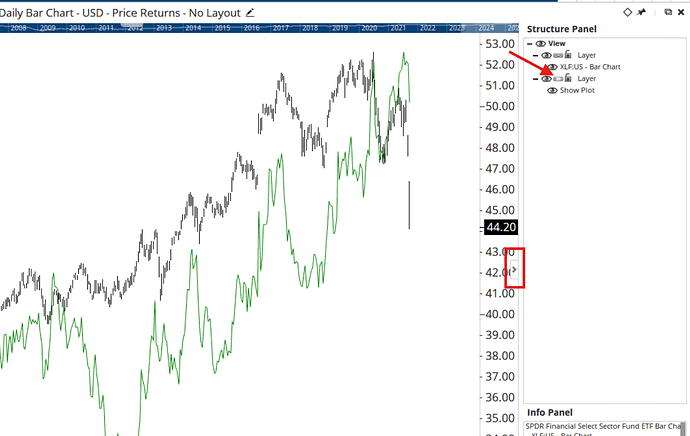
Apply the Show Plot tool with your RS formula, and then open the Structure Panel on the right of the screen and click the chain icon next to the Show Plot layer. This will break the link to the chart’s price scale and will be plotted independently:


