Hi Darren, I would like to set a custom script on my chart using RSI (5) period based on close with Method of (EMA) which I can use with a show view feature as well.
Top color: green; neutral black; and bottom color: red.
Please let me know how I can write a script for it.
Thanks,
Mo
Hi Mo,
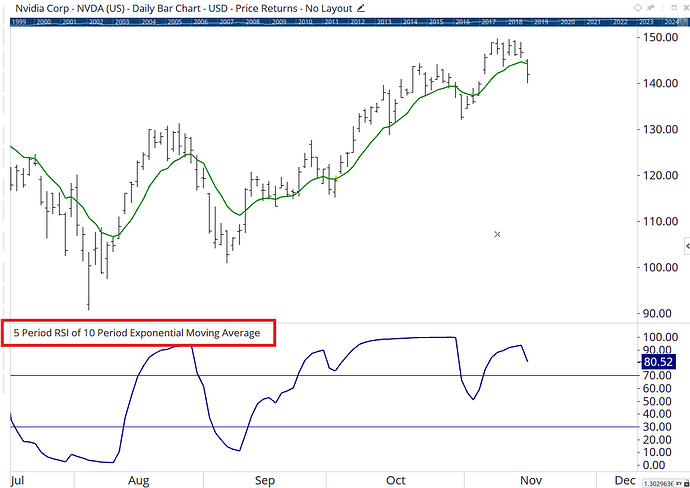
If you want an RSI(5) on an EMA of the price, right-click on the EMA and select the RSI tool and it will use that in the calculations, as per the tool heading:
Or if you want an EMA of the RSI(5) apply the moving average tool to the RSI:
If you need something else please give more more details and I’ll see what I can do.
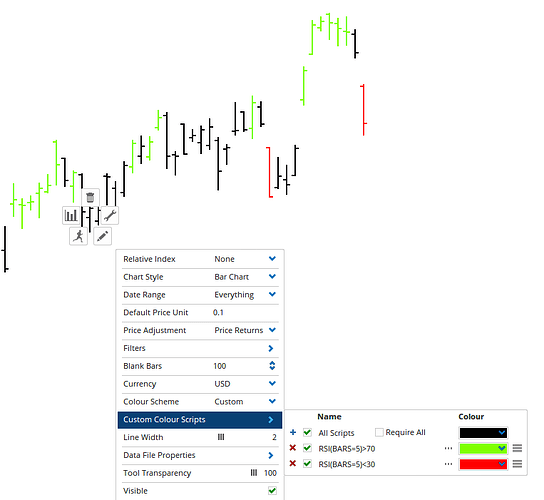
Thanks Darren, I am looking for bars to change colors. When price gets below 30 it turns red, above 70 green and if price stays in between 30 and 70 stay neutral in black.
Thanks,
Mo
Ah ok. What’s the EMA period? And what is the EMA of, the price or the RSI?
5 period RSI and I use 9 and 20 EMA. I have this feature on the motive wave is called RSI bars which has 3 bar colors, red, green and black. I use it every day but I like to set it up on Optuma.
5 period RSI matches the bar color on the chart. If RSI stays at 50 the bars stays black in neutral color, if the price is over bought or over sold it changes colors to red or green.
I tried using RSI 5 > 70 or <30 as show bar feature which works fine but I like to have these color bars on the chart.
Thanks,
Mo
OK thanks. If you already have the formulas for the Show Bars then you can use them for the custom colour scheme. There’s a video here:
Send your workbook to [email protected] if you get stuck.
Excellent. Now I can figure out the rest.
Thank you.


