I know there are Bollinger Band scans available but I can’t get any of them to work.
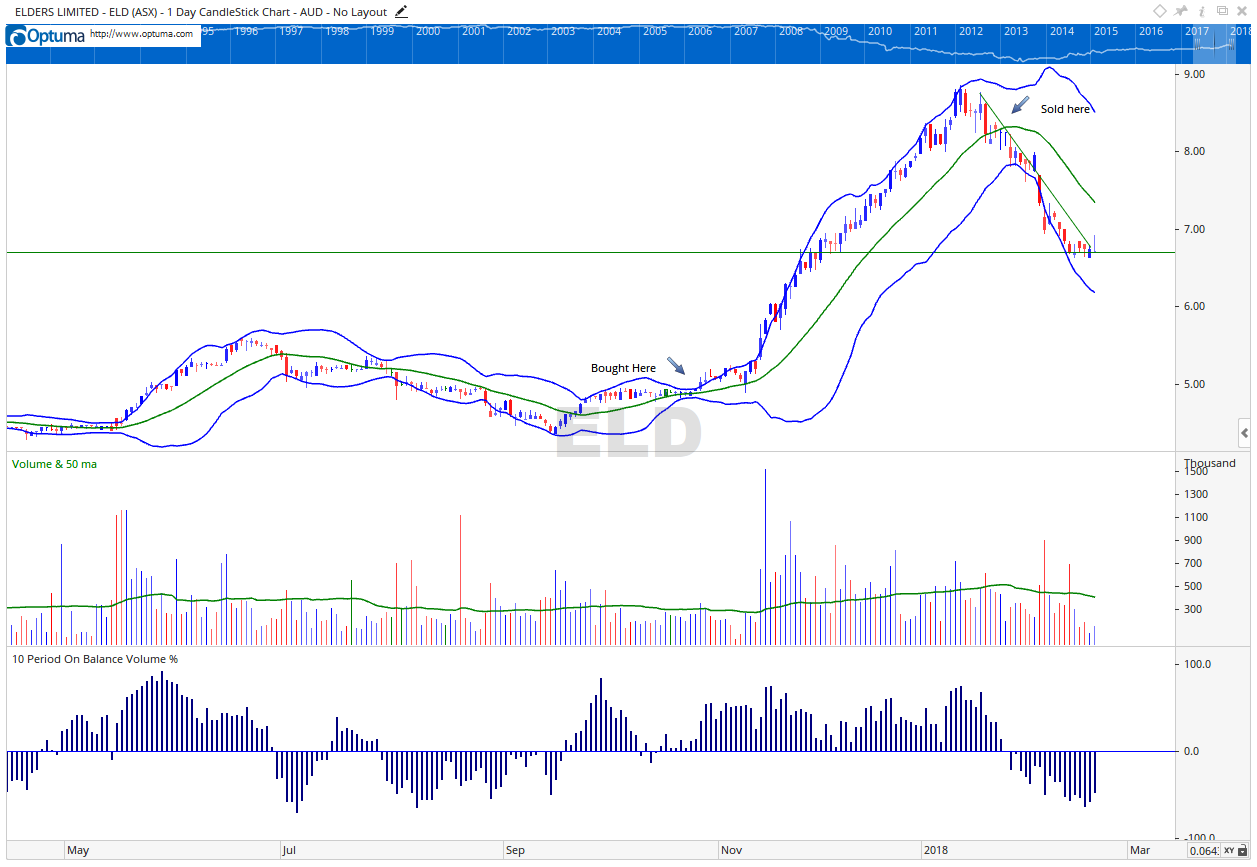
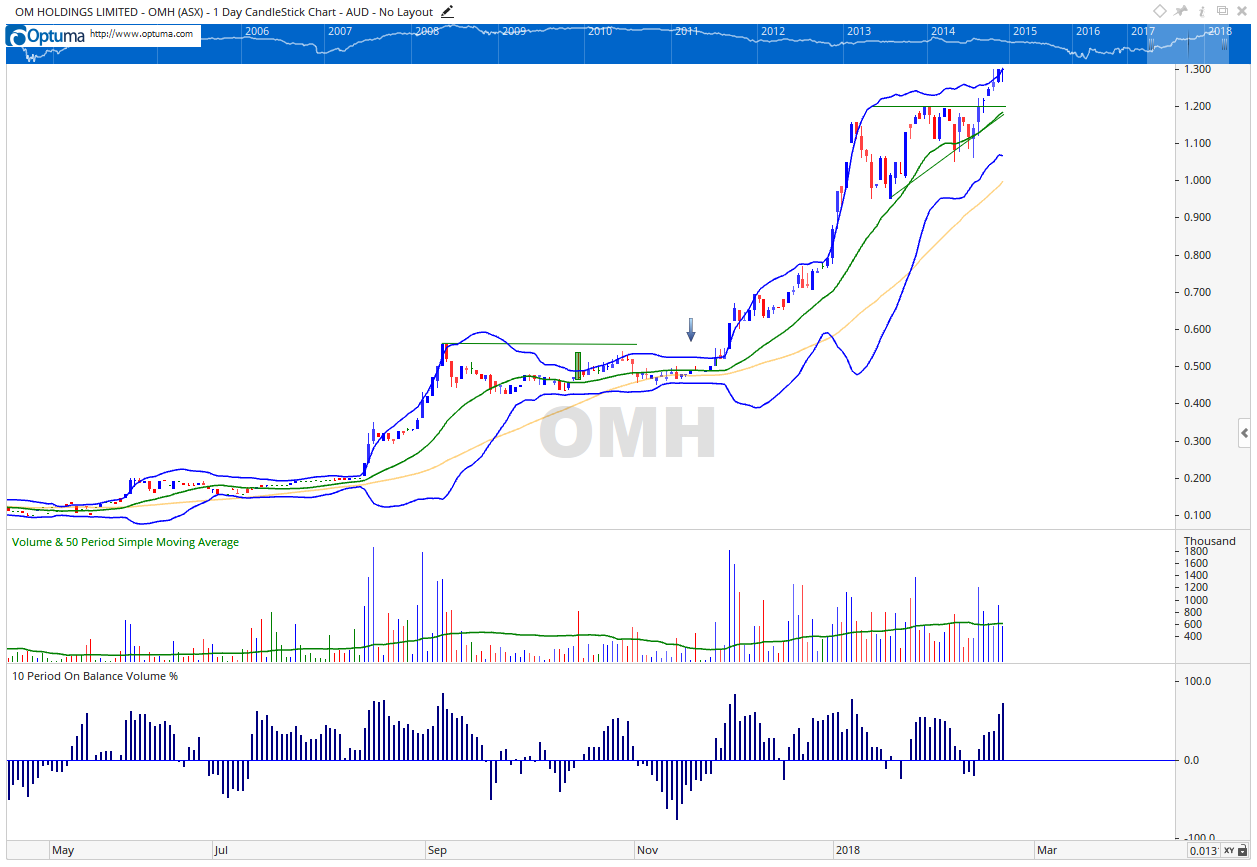
I’m wanting to scan for Tight Bollinger Band squeezes. Attached are 2 example of where the arrows are. The result after a tight squeeze, is price expansion.
Is it possible to scan for these?
Hi David,
The Vergence() function can be used to identify areas of convergence or divergence between two lines on a chart.
In the example of Bollinger Bands you can use something like this:
UBB = BB(BARS=10).UpperLine ;
LBB = BB(BARS=10).LowerLine ;
VERGENCE(UBB, LBB, LOOKBACK=3)
This takes the 10 period Bollinger Band upper and lower lines, and looks for areas of convergence over 3 consecutive days.
On the chart, the green shaded zones show the areas the scripted criteria is passing:

You can modify the Bollinger band settings, and the number of consecutive days that need to occur for the criteria to pass based on your own requirements.
Thanks very much for the info. Greatly appreciated.
One further question. How do you get the green shading to apply to the results?
Hi David,
To show the results in a shaded green area as per my example, apply a Show View tool to the chart and add the script from my original post.
You can then drag and drop the Show View to the main chart window, so it overlays on top of the bars.
Hi Team,
I'm finding the script is generating a lot of results (round 100 per scan) and doing daily, it's too much.
Is there a way to add additional script to this to reduce the numbers. I'm thinking a MA maybe 20 days?
Also, is it possible to script between a MA band? say 40 days and 60 days?
Cheers, Dave.
Hi Dave,
I’m not sure what you mean by MA 20 days… do you mean adding a filter to show only those trading above their MA20? If so then you can add
and CLOSE() > MA(BARS=20)
You could also adjust the Vergence function so that it looks for 4 converging days rather than 3:
VERGENCE(UBB, LBB, LOOKBACK=4)