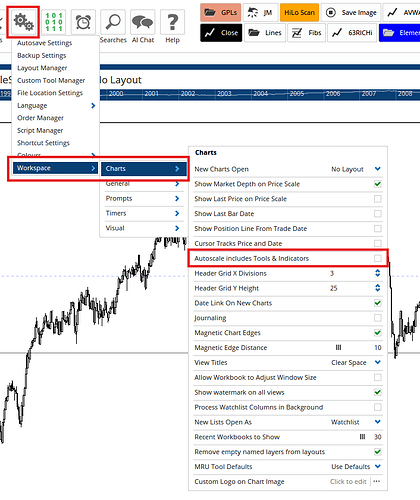
Not sure how to approach.
The below Script Calculates Gan and Fib ratio’s of the All Time Range. It works a treat. I am trying to use the Training manager with this script and fill the screen with Bars, not all the Plots. As I move forward in time with the stock, how do I make the sreen adjust to fit the Price Ranges and not all the calulated Lines?
//All Time Range
H1 = HIGHESTHIGH(RANGE=All Time,INCBAR=True);
L1 = LOWESTLOW(RANGE=All Time,INCBAR=True);

//Calc range;
R1 = (H1-L1);

//Calc GAN levels;
//Calc Fib levels;
PlotLow = L1;
Plot1 = L1+(R1 * 0.166);
Plot2 = L1+(R1 * 0.25);
Plot3 = L1+(R1 * 0.3333);
Plot4 = L1+(R1 * 0.5);
Plot5 = L1+(R1 * 0..6666);
Plot6 = L1+(R1 * 0.75);
Plot7 = L1+(R1 * 0.833333);
Plot8 = L1+(R1);

//Calc Fib levels;
Plot9 = L1+(R1*0.236);
Plot10 = L1+(R1*0.382);
Plot11 = L1+(R1*0.618);
Plot12 = L1+(R1*0.786);

//Set line styles;
Plot1.Colour = Blue;
Plot1.Linestyle = Dash;
Plot1.LineWidth = 1;
Plot1.Caption = 16.66%;
Plot1.Transparency = 30;

Plot2.Colour = Black;
Plot2.Linestyle = Solid;
Plot2.LineWidth = 2;
Plot2.Caption = 25.00%;
Plot2.Transparency = 30;

Plot3.Colour = Blue;
Plot3.Linestyle = Dash;
Plot3.LineWidth = 1;
Plot3.Caption = 33.33%;
Plot3.Transparency = 30;

Plot4.Colour = Red;
Plot4.Linestyle = Dot;
Plot4.LineWidth = 2;
Plot4.Caption = 50.00%;
//Plot4.Transparency = 30;

Plot5.Colour = Blue;
Plot5.Linestyle = Dash;
Plot5.LineWidth = 1;
Plot5.Caption = 66.67%;
Plot5.Transparency = 30;

Plot6.Colour = Black;
Plot6.Linestyle = Solid;
Plot6.LineWidth = 2;
Plot6.Caption = 75.00%;
Plot6.Transparency = 30;

Plot7.Colour = Blue;
Plot7.Linestyle = Dash;
Plot7.LineWidth = 1;
Plot7.Caption = 83.33%;
Plot7.Transparency = 30;

Plot8.Colour = Black;
Plot8.Linestyle = Solid;
Plot8.LineWidth = 2;
Plot8.Caption = 100.00%;
Plot8.Transparency = 70;

Plot9.Colour = Purple;
Plot9.Linestyle = Dash;
Plot9.LineWidth = 1;
Plot9.Caption = 23.60%;
Plot9.Transparency = 30;

Plot10.Colour = Purple;
Plot10.Linestyle = Dash;
Plot10.LineWidth = 1;
Plot10.Caption = 38.20%;
Plot10.Transparency = 30;

Plot11.Colour = Purple;
Plot11.Linestyle = Dash;
Plot11.LineWidth = 1;
Plot11.Caption = 61.80%;
Plot11.Transparency = 30;

Plot12.Colour = Purple;
Plot12.Linestyle = Dash;
Plot12.LineWidth = 1;
Plot12.Caption = 78.60%;
Plot12.Transparency = 30;

PlotLow.Colour = Black;
PlotLow.Linestyle = Solid;
PlotLow.LineWidth = 2;
PlotLow.Caption = 0%;
PlotLow.Transparency = 70;
