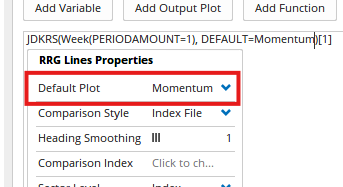
Hi. I’ve encountered some strange scripting behavior that I hope you can help me resolve.
I want to build a data file that will contain weekly RRG functions values for about 600 stocks going back 12 weeks. I plan to use this data for a deep statistical analysis of the stocks’ RRG movements over time. To acquire the needed data, I want to build a series of Optuma workbook pages, each containing the historical data for a given RRG function.
For example, the first workbook page contains 12 columns of data. The first column contains the current week’s JDKRS Ratio function scores, the second column the JDKRS Ratio function scores for the prior bar, and so on going back 12 weekly bars. To load the needed data into the workbook page, I’ve used the following simple one-line script 12 times, each changing the offset value. So:
- JDKRS(Week(PERIODAMOUNT=1)).Ratio
- JDKRS(Week(PERIODAMOUNT=1))[1]. Ratio
- JDKRS(Week(PERIODAMOUNT=1))[2]. Ratio
- …
- JDKRS(Week(PERIODAMOUNT=1))[11]. Ratio
Comparing the resulting values in the columns to the coordinates in a weekly RRG graph indicates that this worked fine. But here’s where it gets strange. The next page I tried to build was for the RRG Momentum function. For the first column JDKRS(Week(PERIODAMOUNT=1)).Momentum worked as expected. However, each subsequent column’s script – e.g., JDKRS(Week(PERIODAMOUNT=1))[1].Momentum for the second column – appears to yield, not the Momentum function value for the requested bar but, rather, the Ratio function value for that bar. Note that I’ve also tried using the “Offset=” method but that yields the same result.
So, I’m ag a loss here. Any idea what I might be doing wrong or how I could get this working as needed? Thanks very much!

