Hello, is there a way to run a script on a specific chart type, for instance, range charts. When I run, for instance, a MACD crossover signal script on the MACD in a range chart, it is still using the daily chart as the inputs. Instead I would like to use the range chart as the input. Is there a way to tell the script the chart type to use for its calculations (ideal) or is there a script that can be added to the language to build range charts in the script itself (not ideal).
Hi Chad,
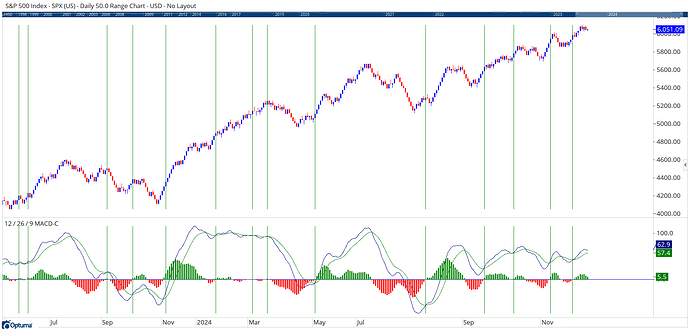
If you open a range chart and then put the MACD on the chart it will be calculated on the range bars, as will the script formulas, such as MACD() CrossesAbove 0 in this Show Bar on a $50 range chart of the SPX:
We do have a RANGECHART() scripting function, but I can’t work out the values that it returns when added to a watchlist column.
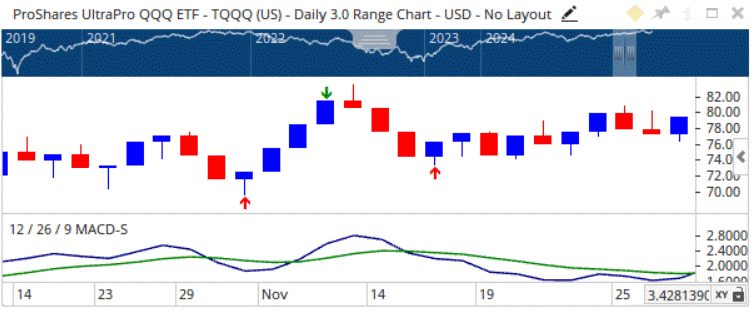
Hey can you post the scripts you are using because mine is not doing as yours… heres the buy script I have:
//Set MACD Properties
MD1 = MACD(TYPE=COMBO);
//Find where the oscillator line crosses above the average line
MD1.OSCILLATOR CROSSESABOVE MD1.AVERAGE
Hi Chad,
I just used MACD() CrossesAbove 0 in a Show Bar, which gives the same results as your script. What are the arrows on your chart?
Make sure to change it to a Range Chart first and then apply the Show Bar, which I changed to a line instead of an arrow in my example.

