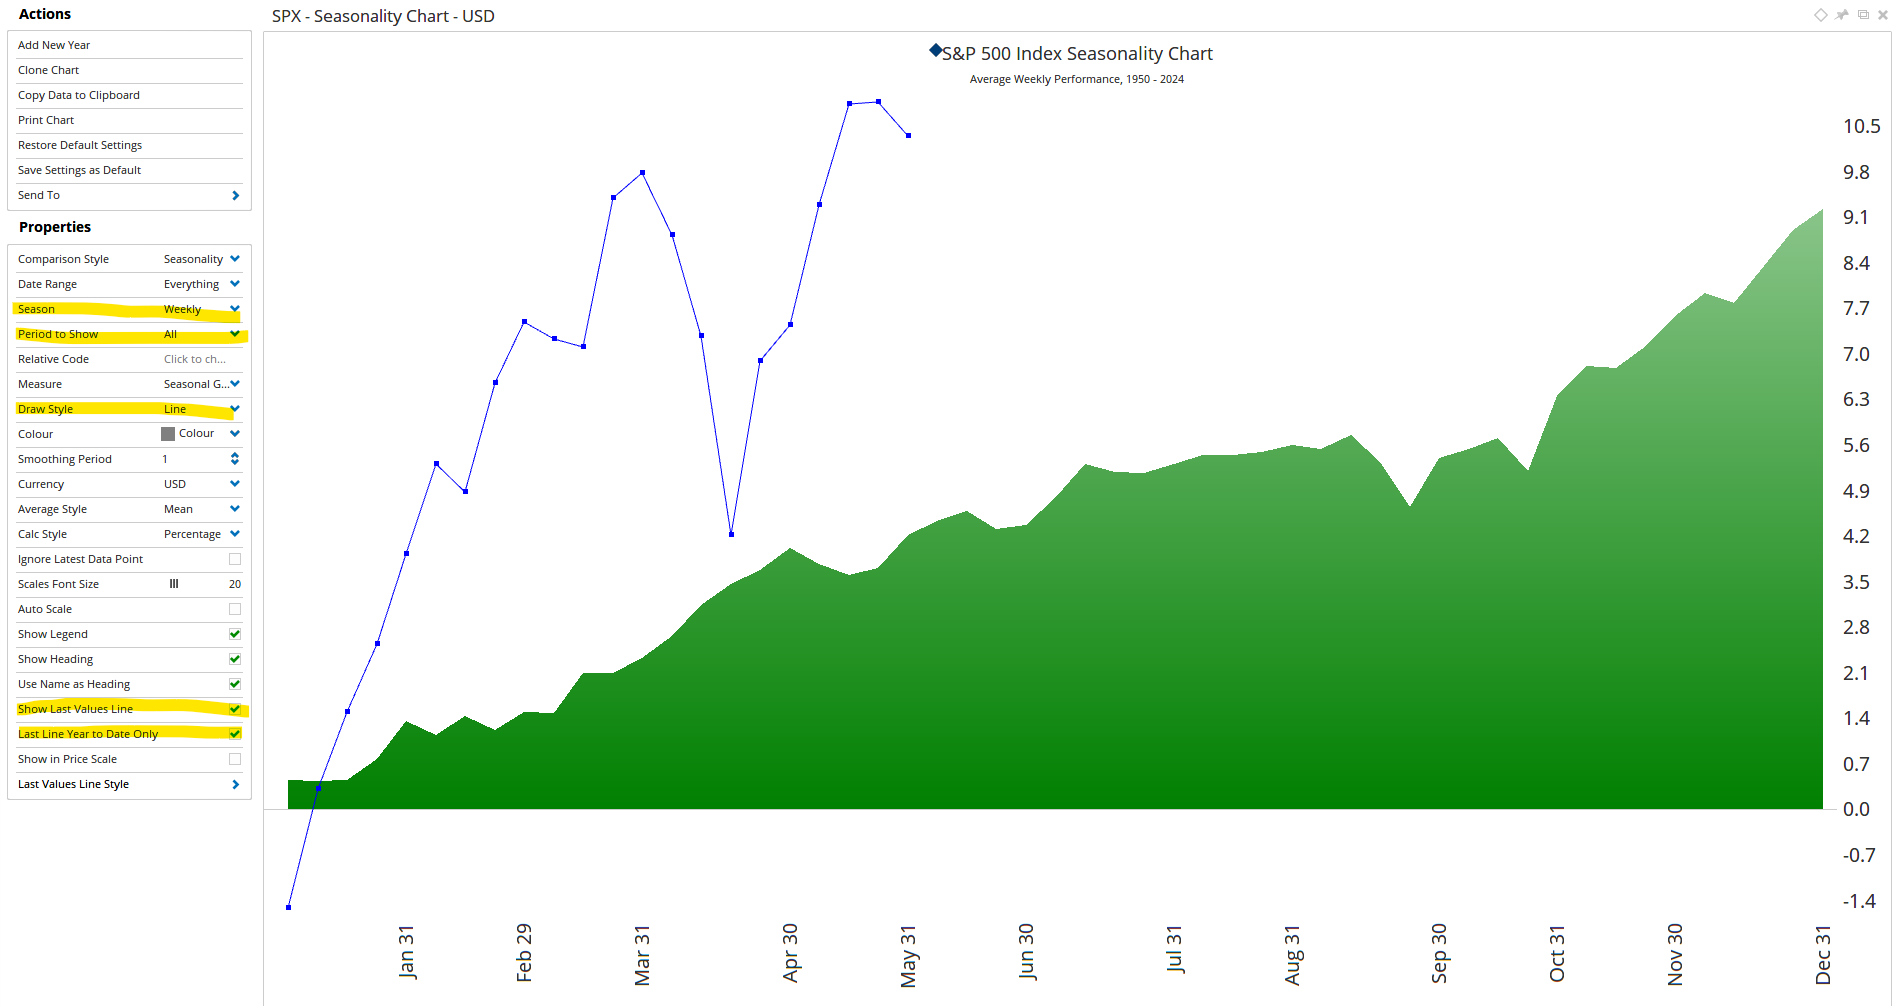
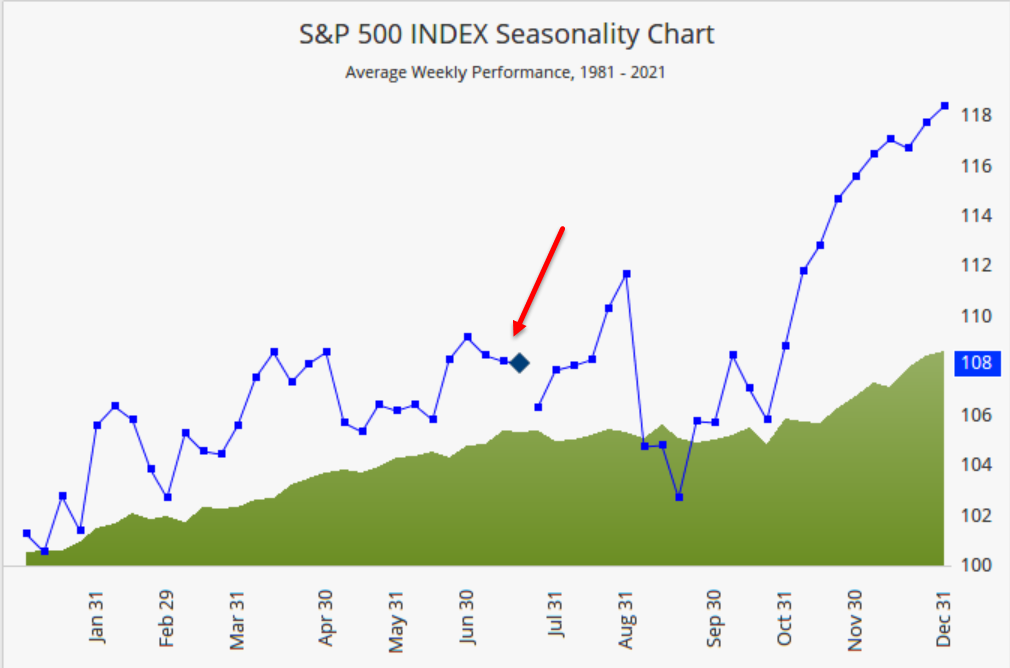
Is there a way to plot only the current YTD growth/decline (show last values line) on top of a seasonal chart? I ask for this as the high growth at year end last year expands the scale so much that its hard to visualize the seasonal aspect.
Thanks Ed - doesn’t look like there’s an option for that so we’ll look in to it.
Hi Ed,
I’ve made the change to hide it, but I need to check with the testers on when we can include this in a build. It may take a couple of weeks.
All the best
Mathew

is this chart possible now? in 2024?