Hi,
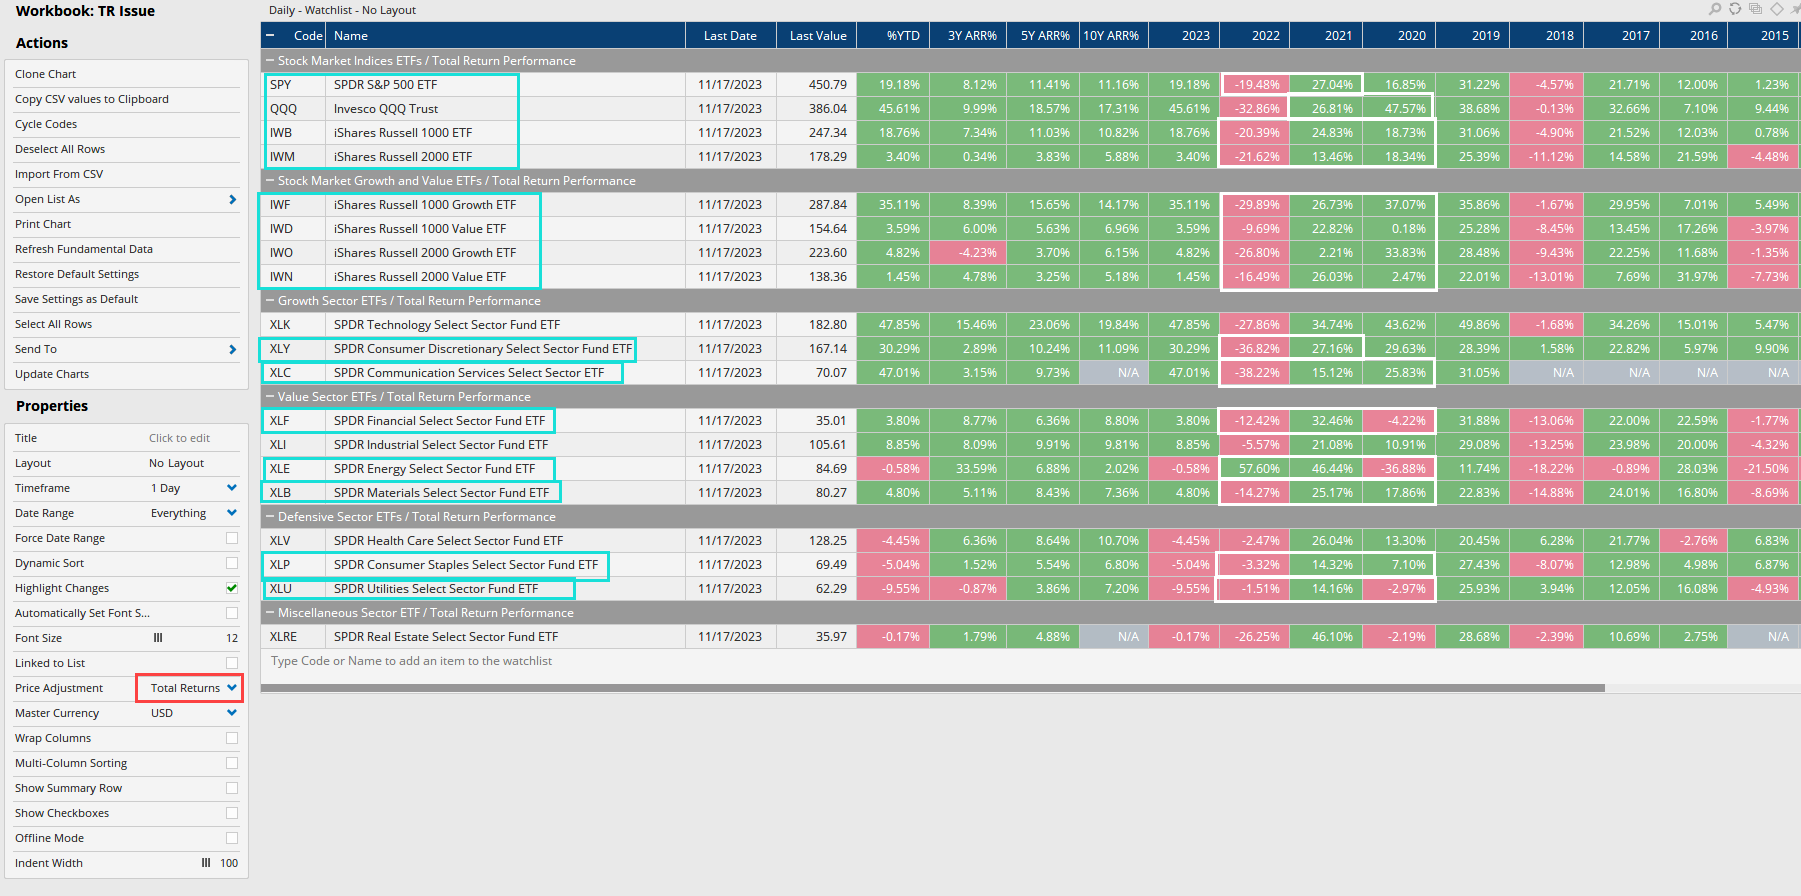
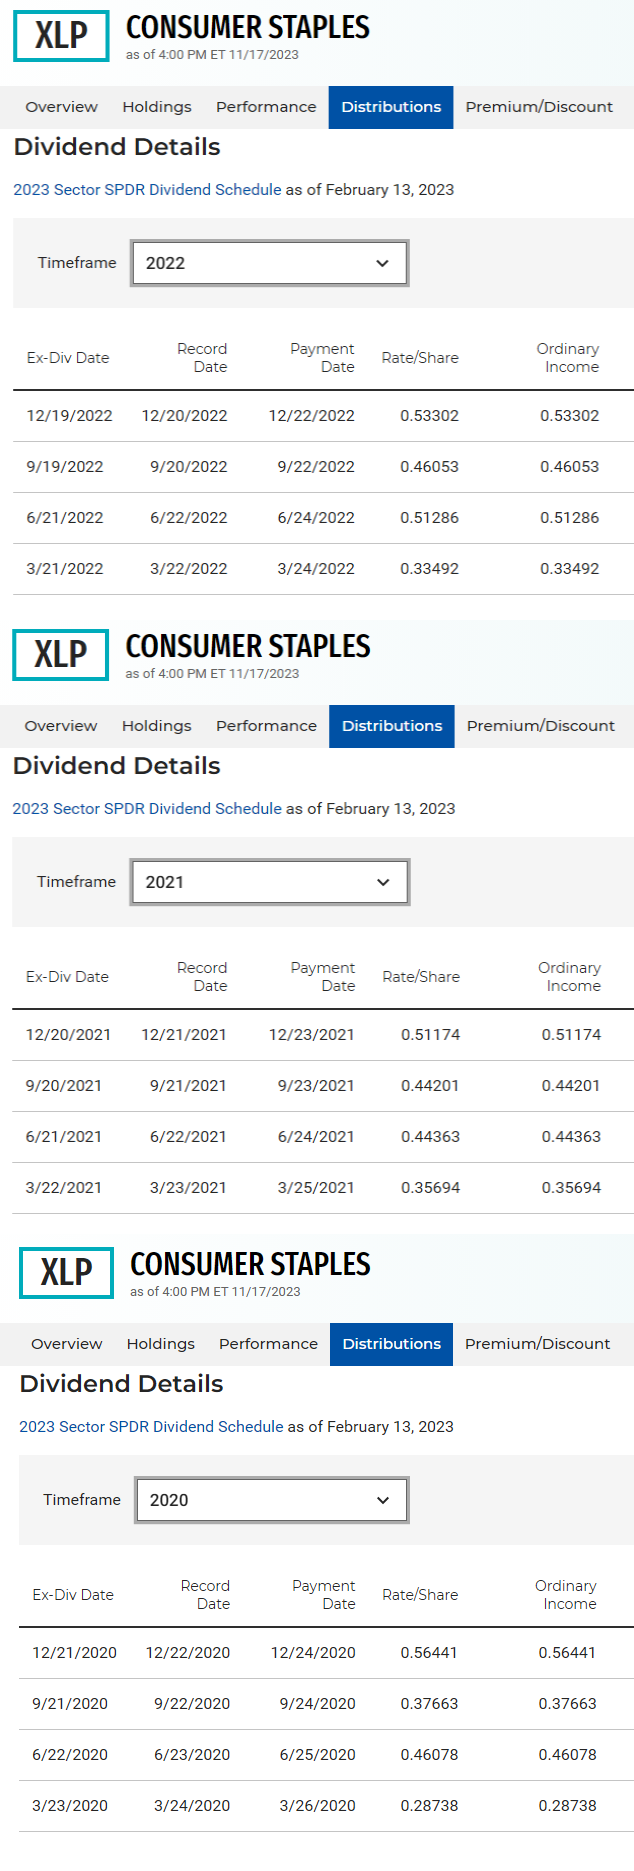
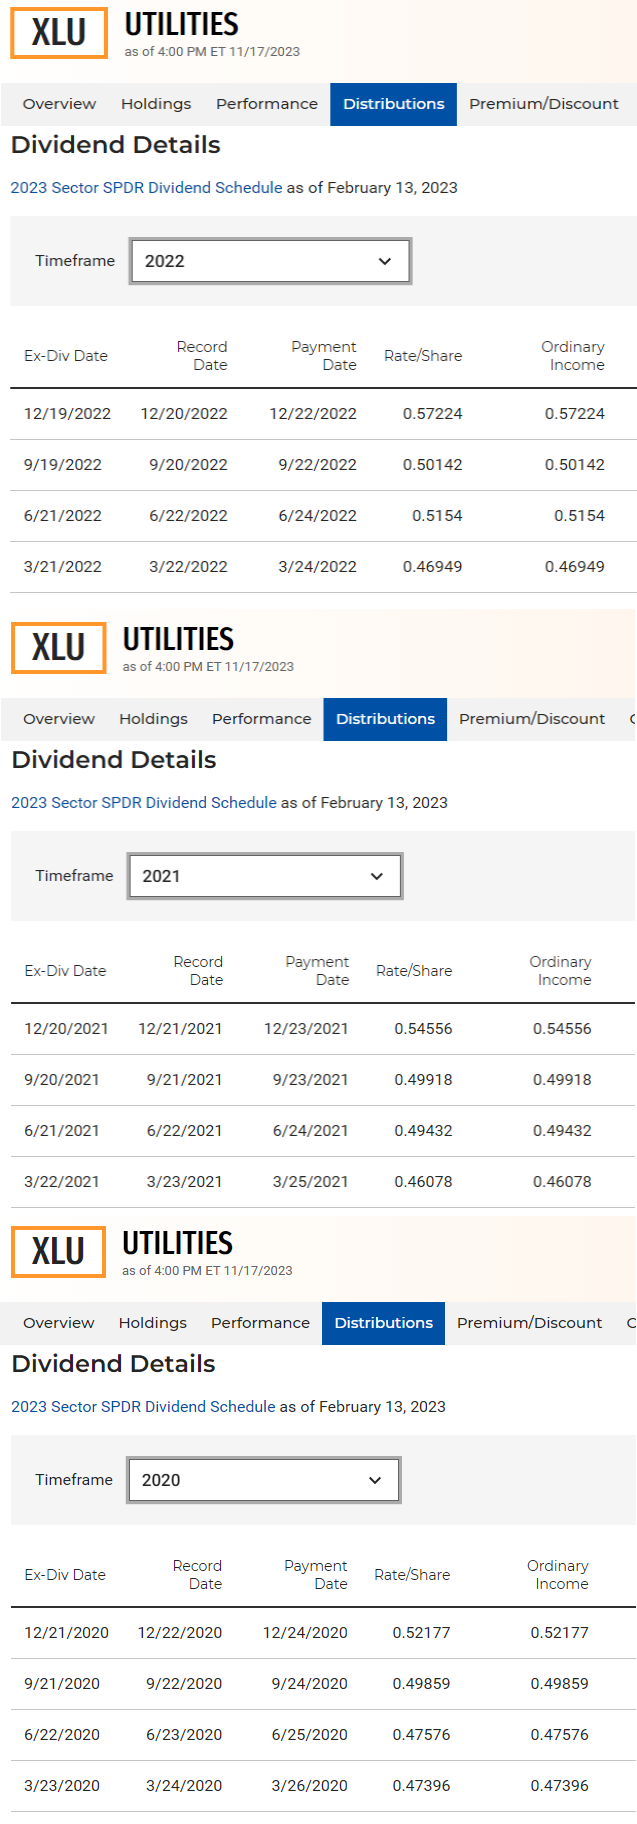
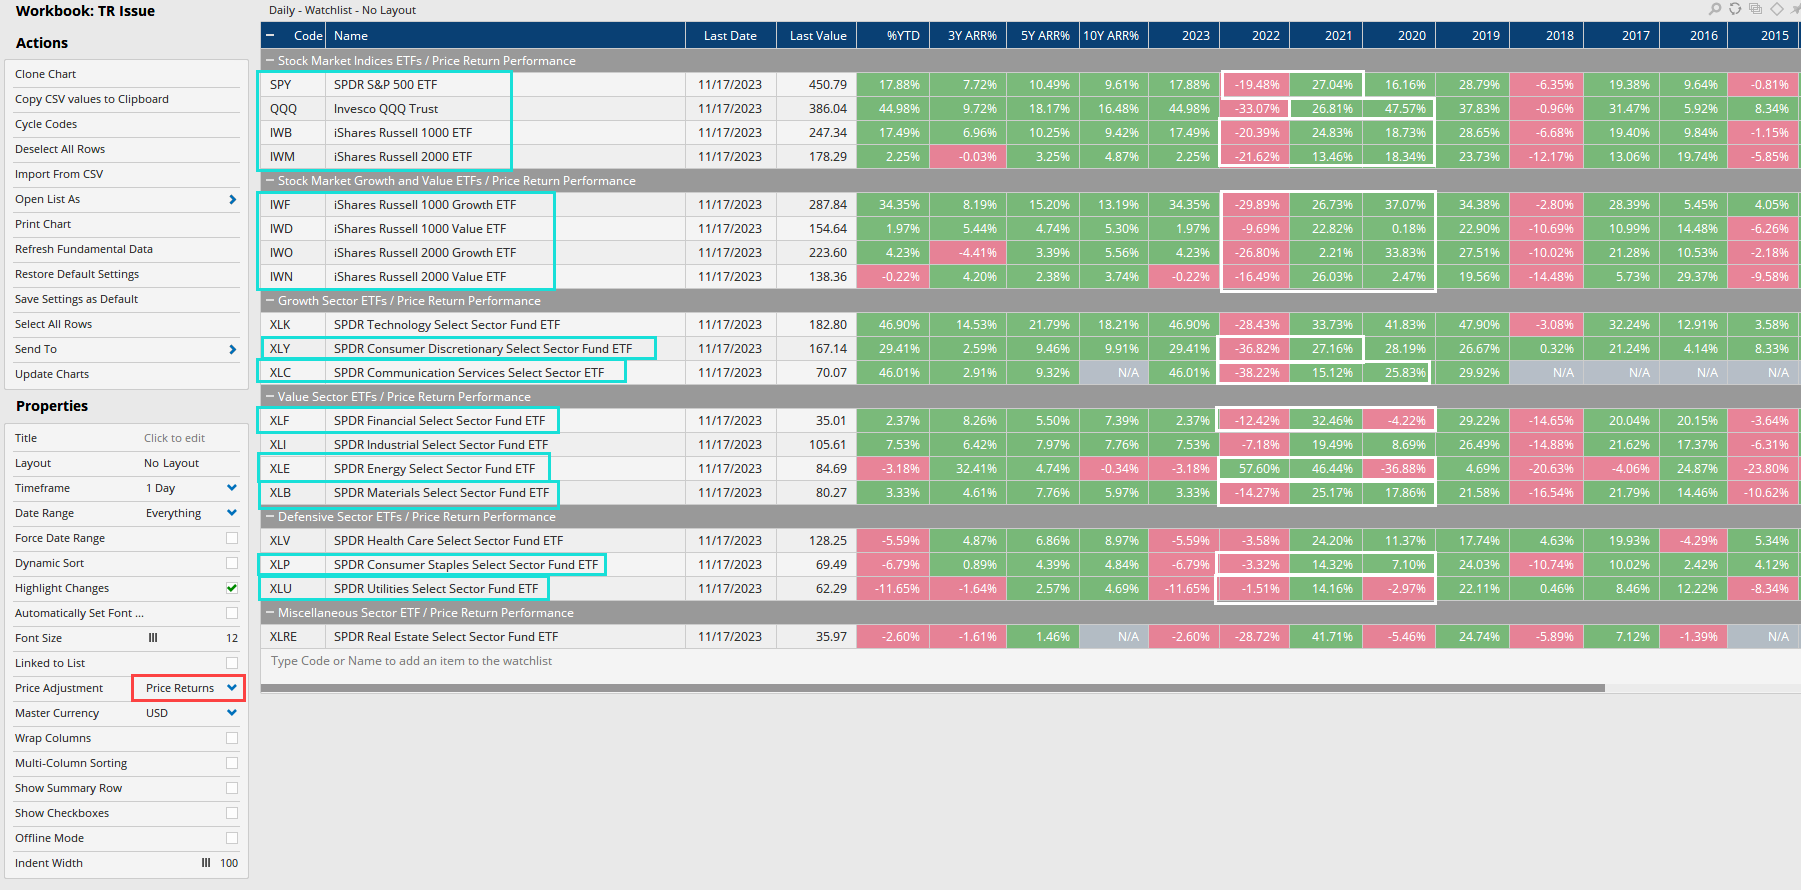
I created a total return index of the three defensive SPDR sector ETFs (Health Care, XLV; Consumer Staples, XLP; and Utilities, XLU) with the Custom Code Builder.
Here is the script:
// Getting the Defensive Sector Total Return Data of ETFs
Line1 = GETDATA(CODE=XLV:US, PRICEADJUSTMENT=Total Returns) ;
Line2 = GETDATA(CODE=XLP:US, PRICEADJUSTMENT=Total Returns) ;
Line3 = GETDATA(CODE=XLU:US, PRICEADJUSTMENT=Total Returns) ;

// Calculating the Equal-Weighted Total Return Index of Defensive Sector ETFs
Line4 = POWER(POWER=0.3333, Line1 * Line2 * Line3) ;
Line4
The script works as it should, no problem.
I have also created a total return index of the three defensive sector indices (Health Care, SP500-35TR; Consumer Staples, SP500-30TR; and Utilities, SP500-55TR) with the Custom Code Builder.
The script is the following:
// Calculating the Equal-Weighted Total Return Index of Defensive Sector Indices
POWER(POWER=0.3333, SP500-35TR:SPI * SP500-30TR:SPI * SP500-55TR:SPI)
Again, the script works as it should, no problem.
Now I have created a Relative Comparison Chart with the base 10-year ago.
Here is the chart:

As you can see, the spread between these two total return indices is very wide at around 17.4%.
I have no idea why the spread has started to widen since 2020.
Does anyone have a suggestion as to why the spread between the two total return indices is so wide?
Thanks very much for any suggestion.
Best wishes,
Thomas