Does anyone know how to have overbought region and oversold region shaded with RSI? I would only want shading above 70 and below 30.
Thanks.
Does anyone know how to have overbought region and oversold region shaded with RSI? I would only want shading above 70 and below 30.
Thanks.
Hi,
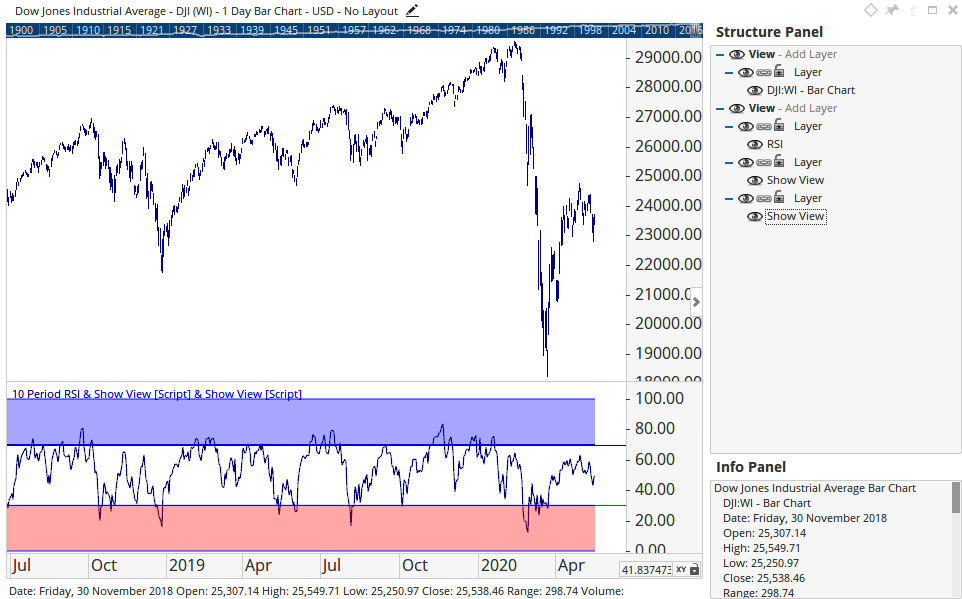
You can do this using two plots and the Shade() function (would need two scripts, one for each shaded range).
For example, to shade 70 - 100 you could use the following:
plot1 = 70;
plot2 = 100;
SHADE(plot1, plot2, SHADEALPHA=35)
Then setup a similar script for the 0 - 30 range. Once done add the script to a Show View and have it sit on top of an RSI. The end result looks like this:
Example workbook attached.
Shaded-RSI.owb (12.7 KB)
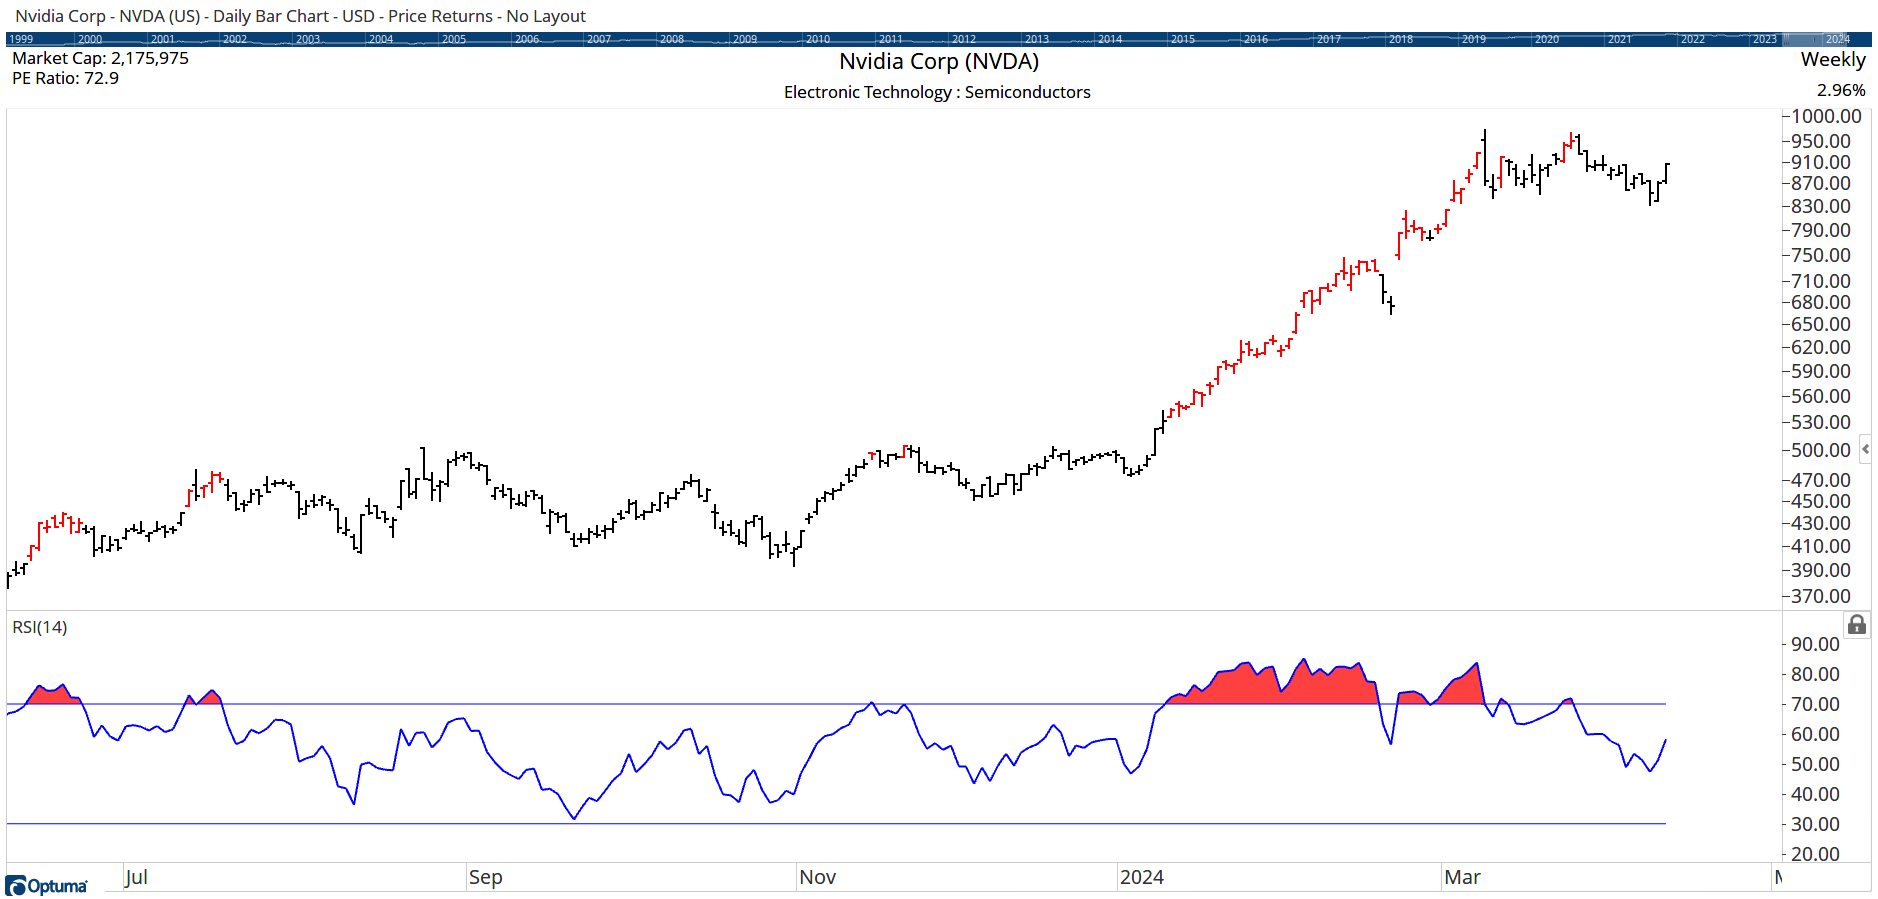
Hello, I’m looking to go a step further, and implement shading above 70 and the RSI line itself not the entire band.
i thought the following would work (using 14 period RSI):
plot1 = 70;
plot2 = RSI(Day(PERIODAMOUNT=1), BARS=14);
SHADE(plot1, plot2, SHADEALPHA=35)
but I am getting some very strange results. thoughts?
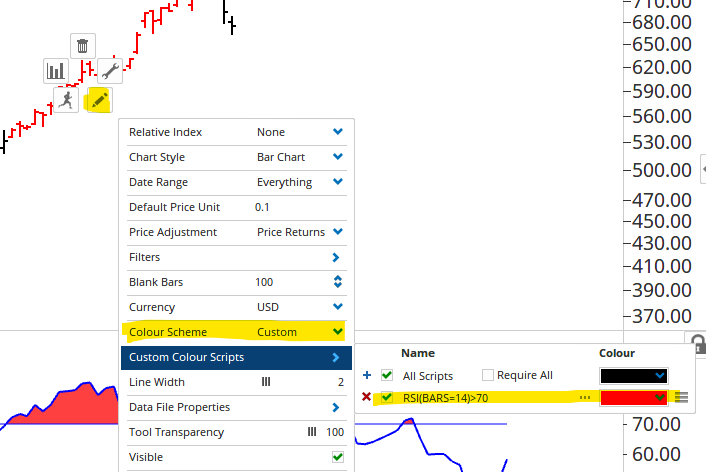
Hi Emilio,
Is this what you need?
Plot1=RSI(BARS=14);
Plot2=70;
Plot3=30;
Plot4=SHADE(Plot1, Plot2, UPCOLOUR=Red, DOWNCOLOUR=White);
Note that the price bars have also been coloured red where the RSI is above 70: