Hello Team
Can you display the dividends on the charts similar to how it’s done on the interactive brokers platform?
Its a little bit of a process but you can plot dividends on the price chart. You can download the data from Yahoo and then if you have an excel add-in like SMF or XLQ you can append the file to automatically update the data. Use the process to import the data described here: Formatting and Importing Text (.csv) Files
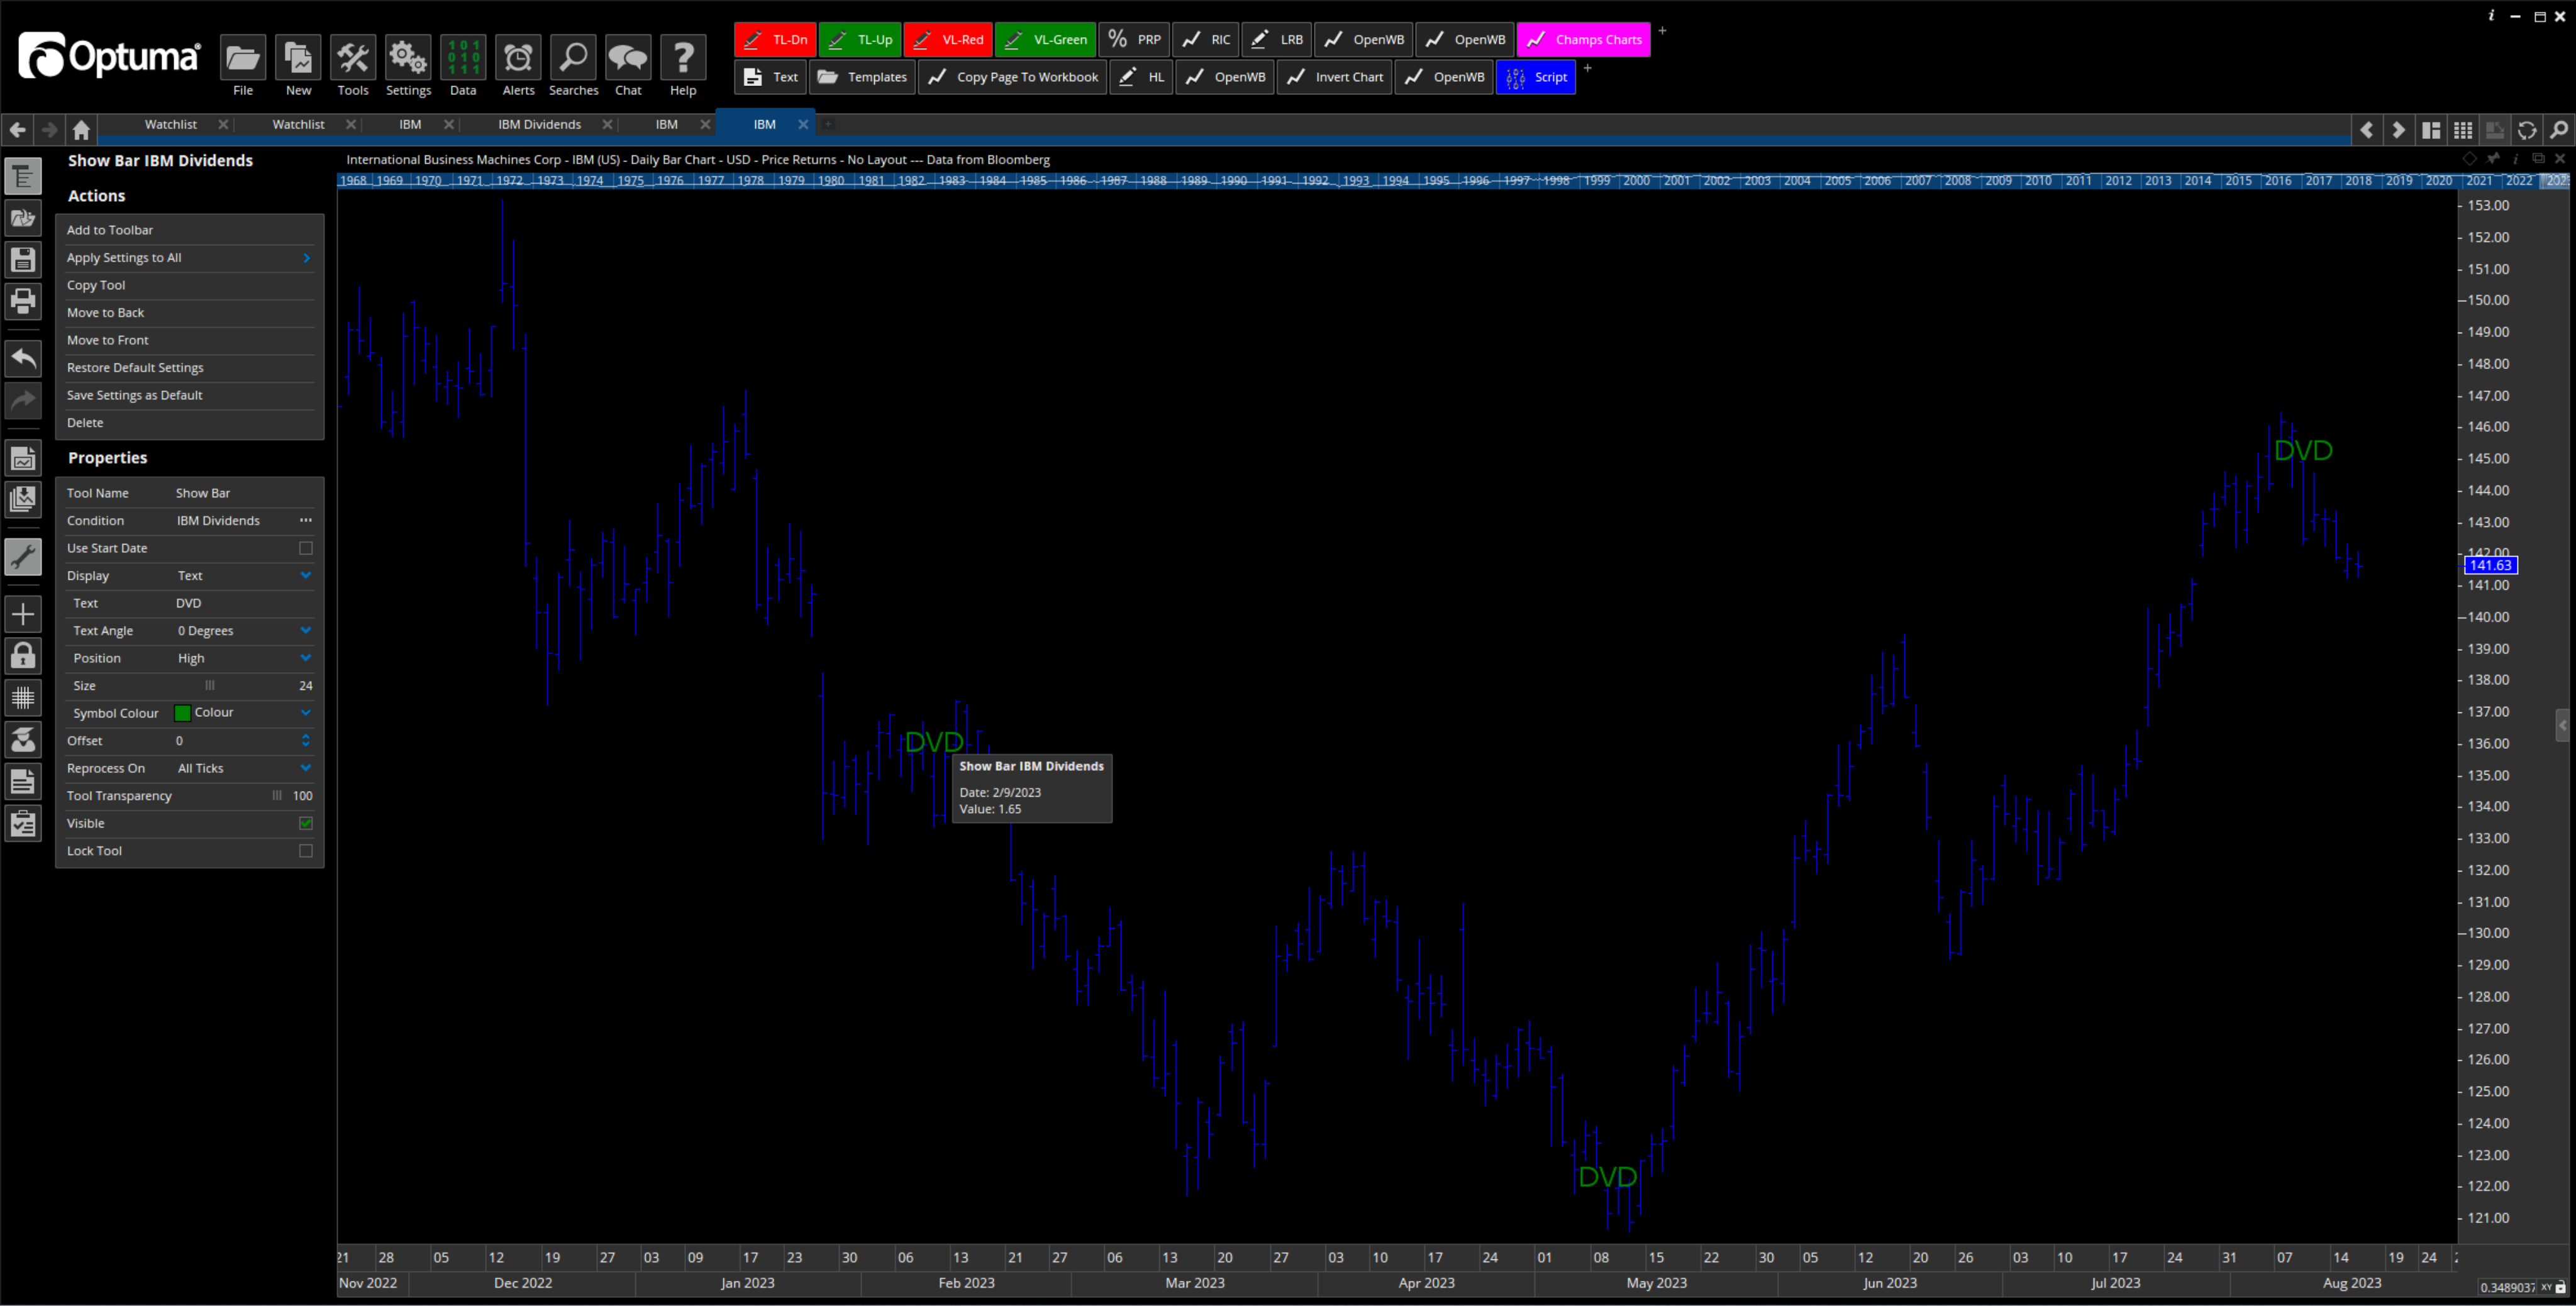
You can use this code to plot the show bars.
V1 = GETDATA(CODE=ExampleDates:CSV,1) ;//name of your csv file

V1 > 0
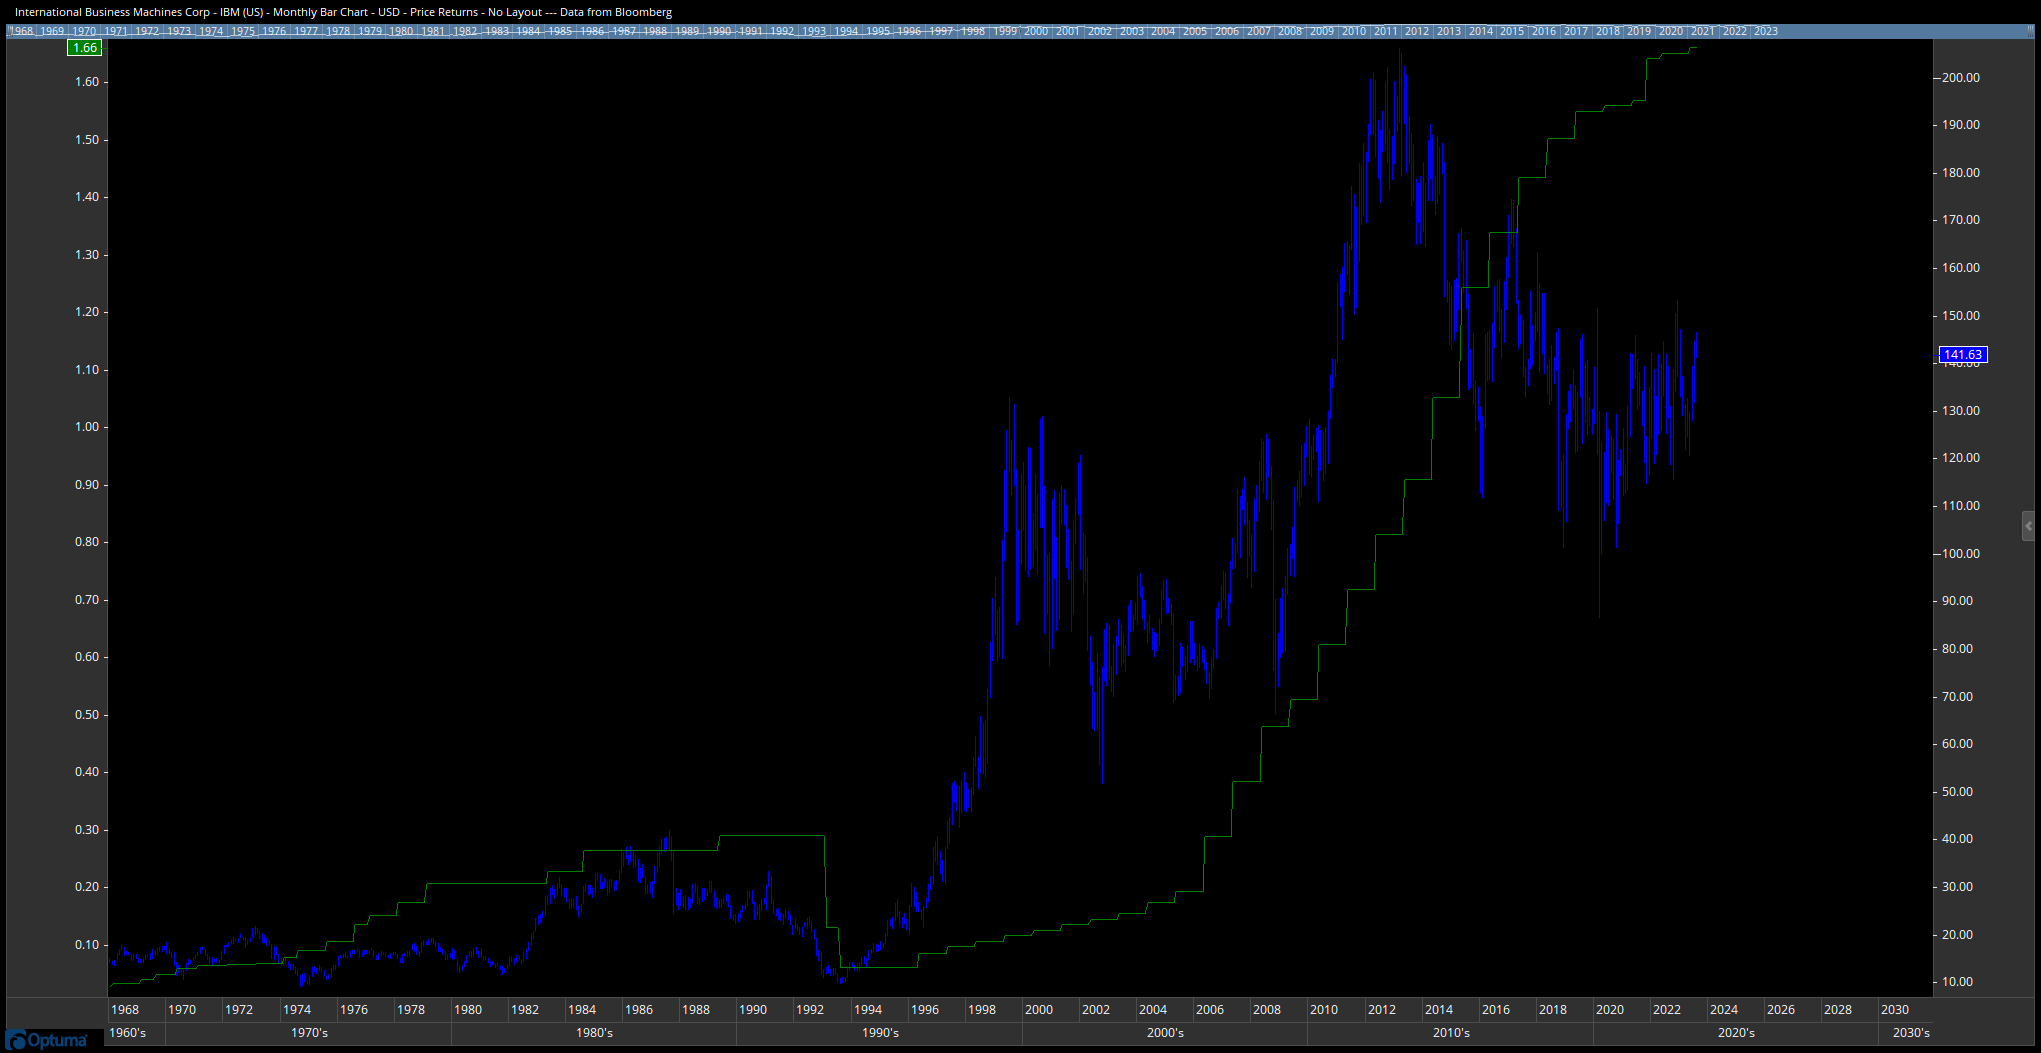
Here are a couple of samples charts for style.