For the past couple of years we have been participating in the Traders’ Tips section of Stocks & Commodities magazine (www.traders.com) where we include scripting formulas for tools and indicators discussed in the article.
The attached workbook can be downloaded and opened in your copy of Optuma with examples of charts with the formulas, and new ones will be added to this thread as new articles are published.
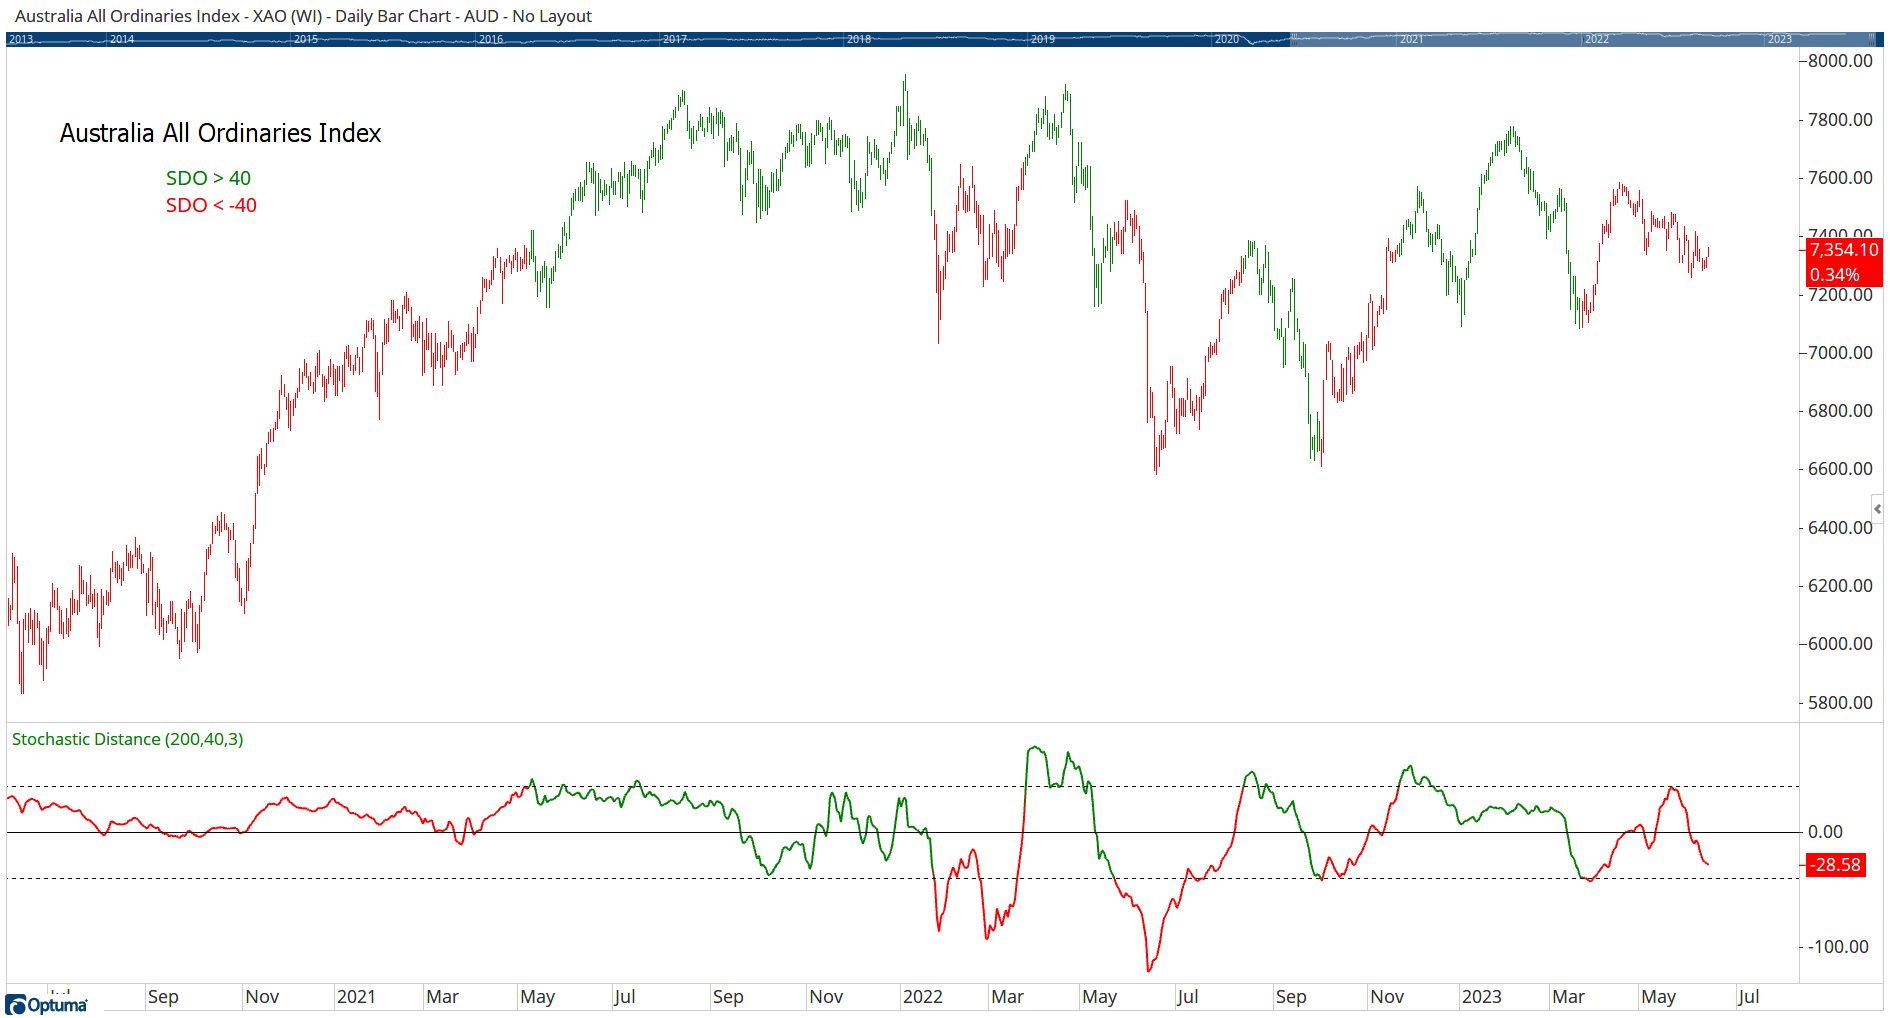
Here’s the Stochastic Distance Indicator from the June 2023 edition which can be used in a Show View tool:
//Stochastic Distance by Vitali Apirine - Stocks & Commodities June 2023;
$LBPeriod=200;
$Period=40;
$Pds=3;
Dist1 = ABS(CLOSE()-CLOSE(OFFSET=$Period));
D1=(Dist1-LOWESTLOW(Dist1, BARS=$LBPeriod)) / (HIGHESTHIGH(Dist1, BARS=$LBPeriod) - LOWESTLOW(Dist1, BARS=$LBPeriod));
DD1=IF(CLOSE()>CLOSE(OFFSET=$Period),D1, IF(CLOSE()<CLOSE(OFFSET=$Period),D1*-1,0));
MA(DD1, STYLE=Exponential, BARS=$Pds)*100
SC-TradersTips.owb (137 KB)