Hi,
I've been trying to code the Supertrend indicator (similar to WVS()) but havent been able to complete this. This is my code so far:
varup1 = ((high()+low()) / 2) + 3*atr();
varup2 = ((high(OFFSET=1)+low(OFFSET=1)) / 2) + 3*atr();
vardown1 = ((high()+low()) / 2) - 3*atr();
vardown2 = ((high(OFFSET=1)+low(OFFSET=1)) / 2) - 3*atr();
finalup = if((varup1 < varup2) AND close(OFFSET=1) < (I'm getting stuck from here)
plot1 = var1;
plot2 = var2;
The Original Rules
BASIC UPPERBAND = (HIGH + LOW) / 2 + Multiplier* ATR
BASIC LOWERBAND = (HIGH + LOW) / 2 – Multiplier* ATR
FINAL UPPERBAND = IF ((Current BASIC UPPERBAND< Previous FINAL UPPERBAND) and (Previous close < Previous FINAL LOWERBAND)) THEN (Current BASIC LOWERBAND) ELSE Previous FINAL LOWERBAND)
FINAL LOWERBAND = IF( (current BASIC LOWERBAND > Previous FINAL LOWERBAND) and (Previous Close < Previous FINAL LOWERBAND) ) THEN (Current BASIC LOWERBAND ) ELSE Previous FINAL LOWERBAND )
SUPERTREND = IF (Current Close <= Current FINAL UPPERBAND) THEN current FINAL UPPERBAND ELSE Current FINAL LOWERBAND
any help would be appreciated. I'm stuck on the Final Upper/Lowe Bands.
cheers
Mandeep
Hi Mandeep,
This tool uses two recursives within a single function which is not compatible with our scripting language at this time. To achieve this in Optuma you would need to code it in the Pascal based custom tool programming module.
https://help.optuma.com/kb/faq.php?cid=4
Hi Mandeep,
I want give you some suggestions about some alternatives for your SuperTrend Indicator that are already available as tools/indicators in Optuma.
The closest match to your SuperTrend Indictor is the “Wilder Volatility Stop” indicator.
The second one is the “ATR Trailing Stop” indicator but with this indicator you have to do the switch between up and down trend manually.
The third alternative is the “Fixed Days High Stop” and Fixed Days Low Stop”. But as with the “ATR Trailing Stop” indicator you have to do the switch between up and down trend manually.
Hope this is of help for you.
I’ve had a look at the scripting and it is a little hard - we’ll see if we can add it into Optuma 1.6
Hi Mandeep,
Just to let you know that the SuperTrend tool will be available in 1.6. You will also be able to create script formulas for scans, such as close crossing the SuperTrend ie change in trend. Look out for update news in the next couple of weeks!

Good day. Is it possible for me to see the scripting for the SupeTrend tool.
Many thanks
Steve
Hello, Super Trend is a great buy and sell indicator. I’ve been using this indicator on Optuma for a while and have had great results so far. Here is the best way you can use this indicator with settings.
Select 3 different super trends on one chart (preferably a 1-hour chart only) and use these settings.
ATR 10, Multiplier 1.00
ATR 11, Multiplier 2
ATR 12, Multiplier 3
Now select show bar features and script them individually.
CLOSE() CrossesAbove ST(BARS=10, MULTI=1.00)
CLOSE() CrossesAbove ST(MULTI=2.00, BARS=11)
CLOSE() CrossesAbove ST(MULTI=3.00, BARS=12)
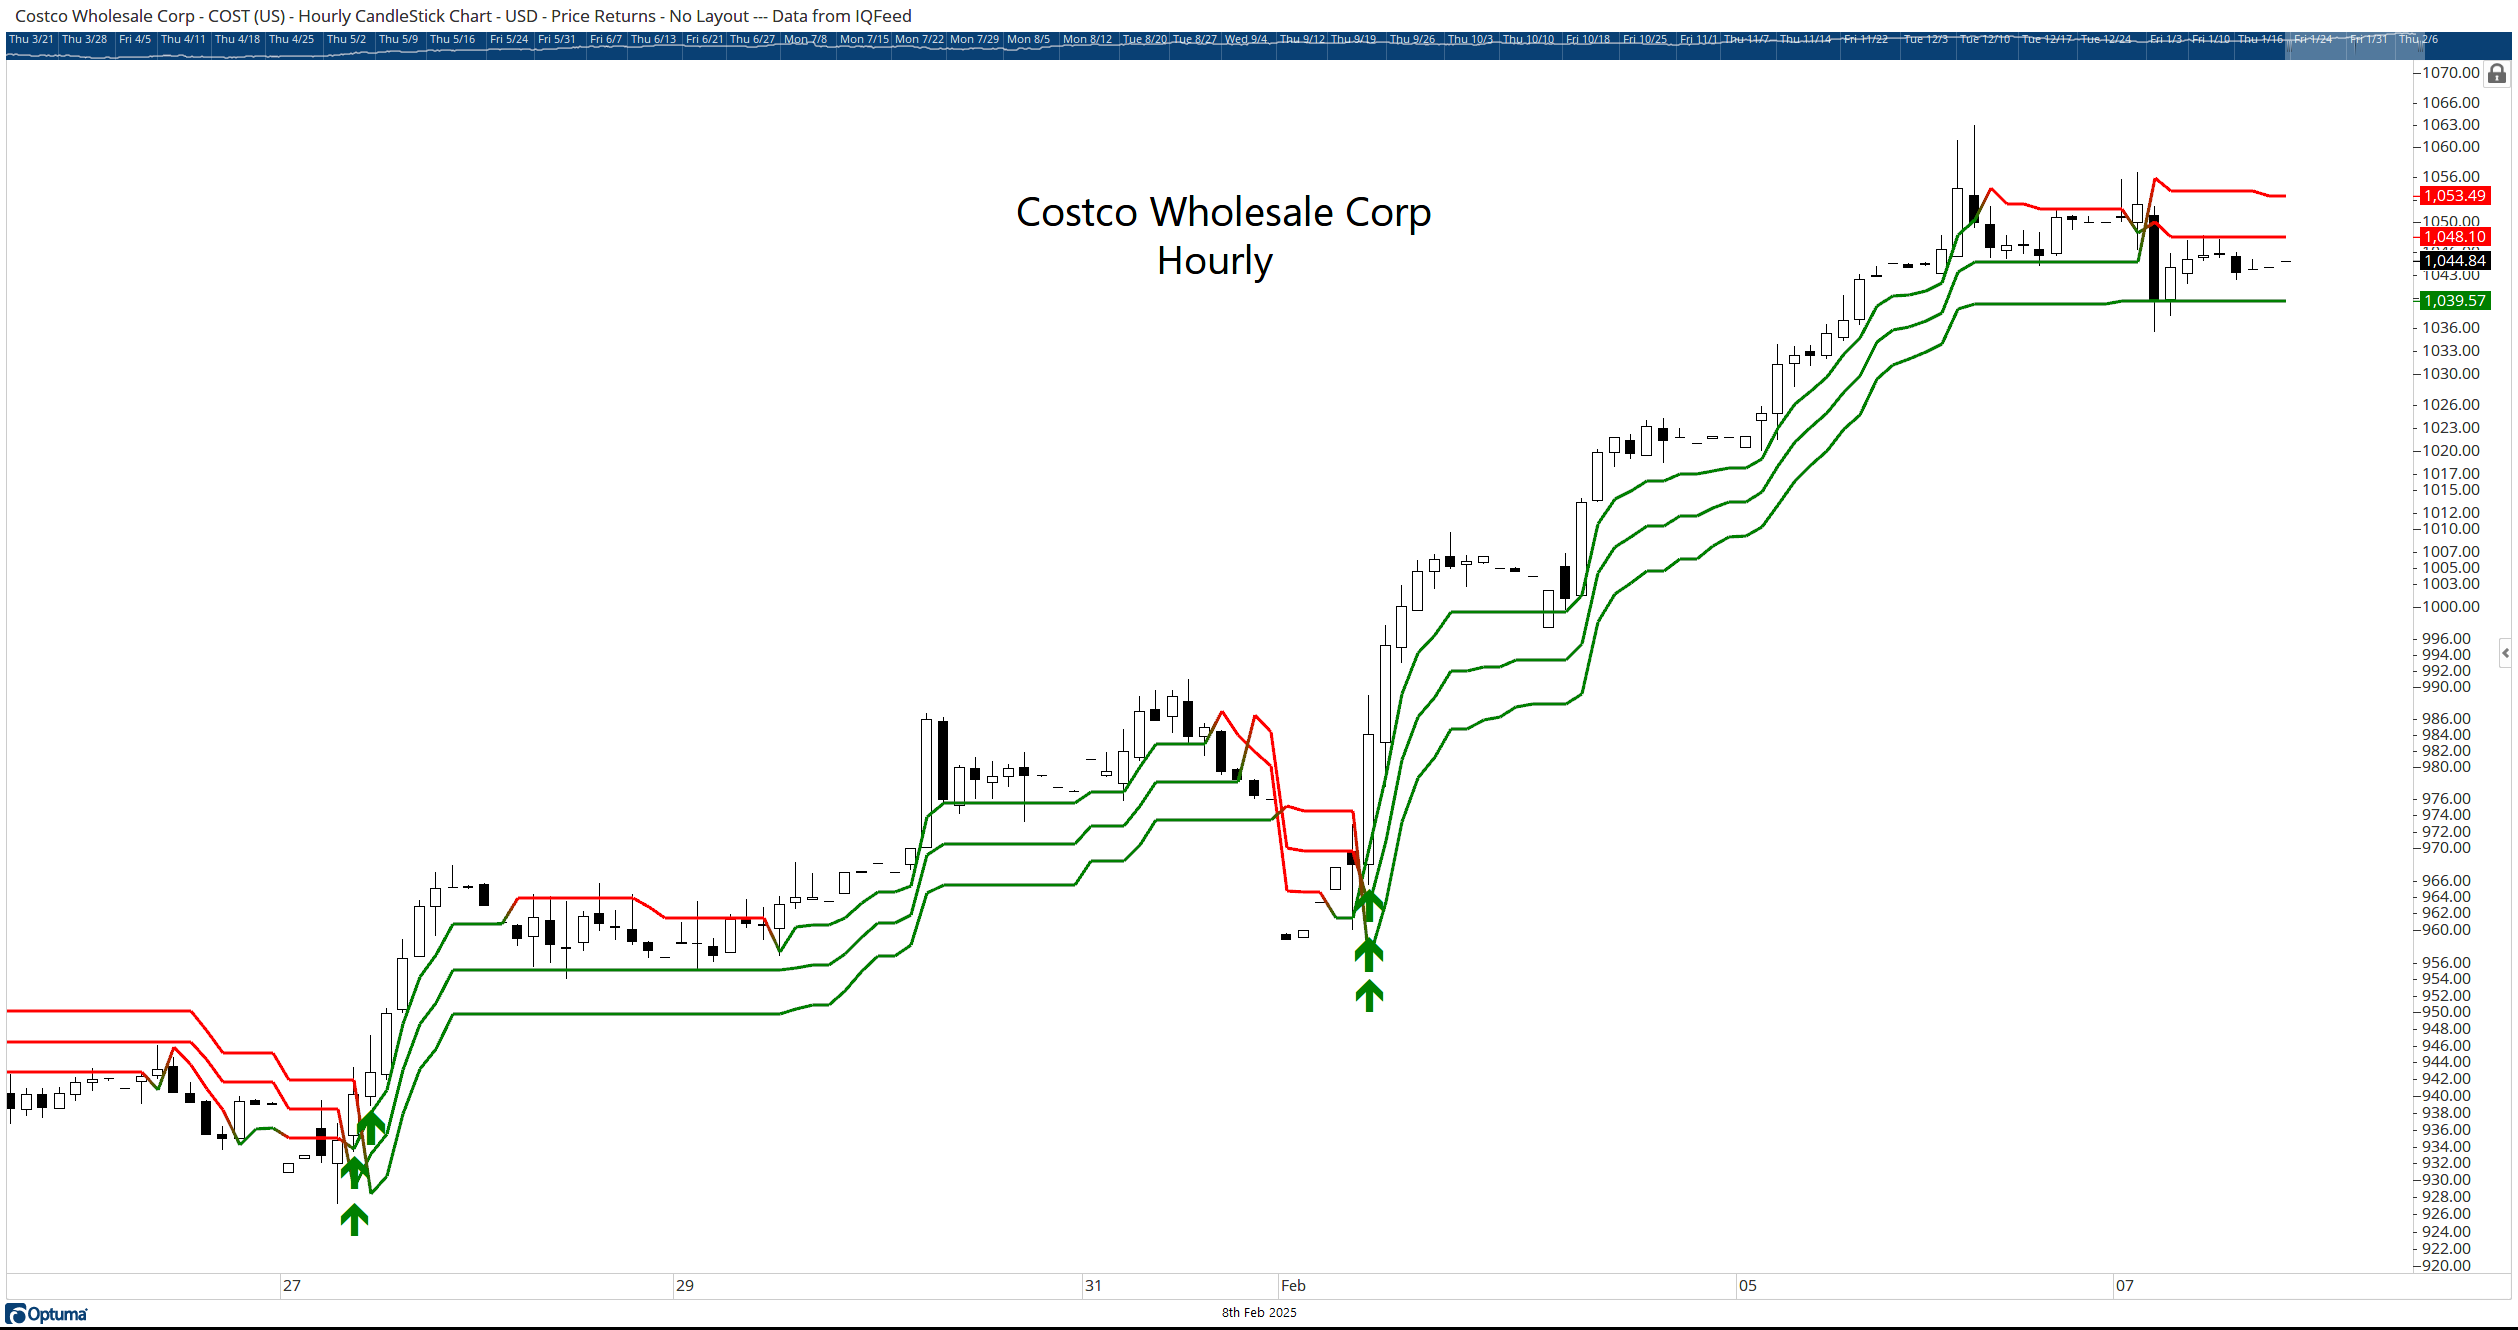
The reason for using 3 different Super Trends is to filter the price and get a great entry. Try to avoid smaller time frames. When you see all 3 buy signal triggers on 1 hour and the band turns green, that is when you go long. You must use the stop loss at the low of the band and stay in the trade until the band turns red with trailing stops. You can practice it on a paper account and see how it goes.
THIS IS NOT FINANCIAL ADVICE!
Thanks,
Mo
Here is an example of COST 1 hour chart,