The PercentSwing can only be a positive number, so the BullPct should be 5, with the direction determined by the SwingDown. However, I would use TurnsDown and TurnsUp to get the signal days (so they occur once the required % moves have been made, ie not at the high and the low).
The Switch itself is true when the first condition is met (5% move from a high), and stays true until a 7% move off a low.
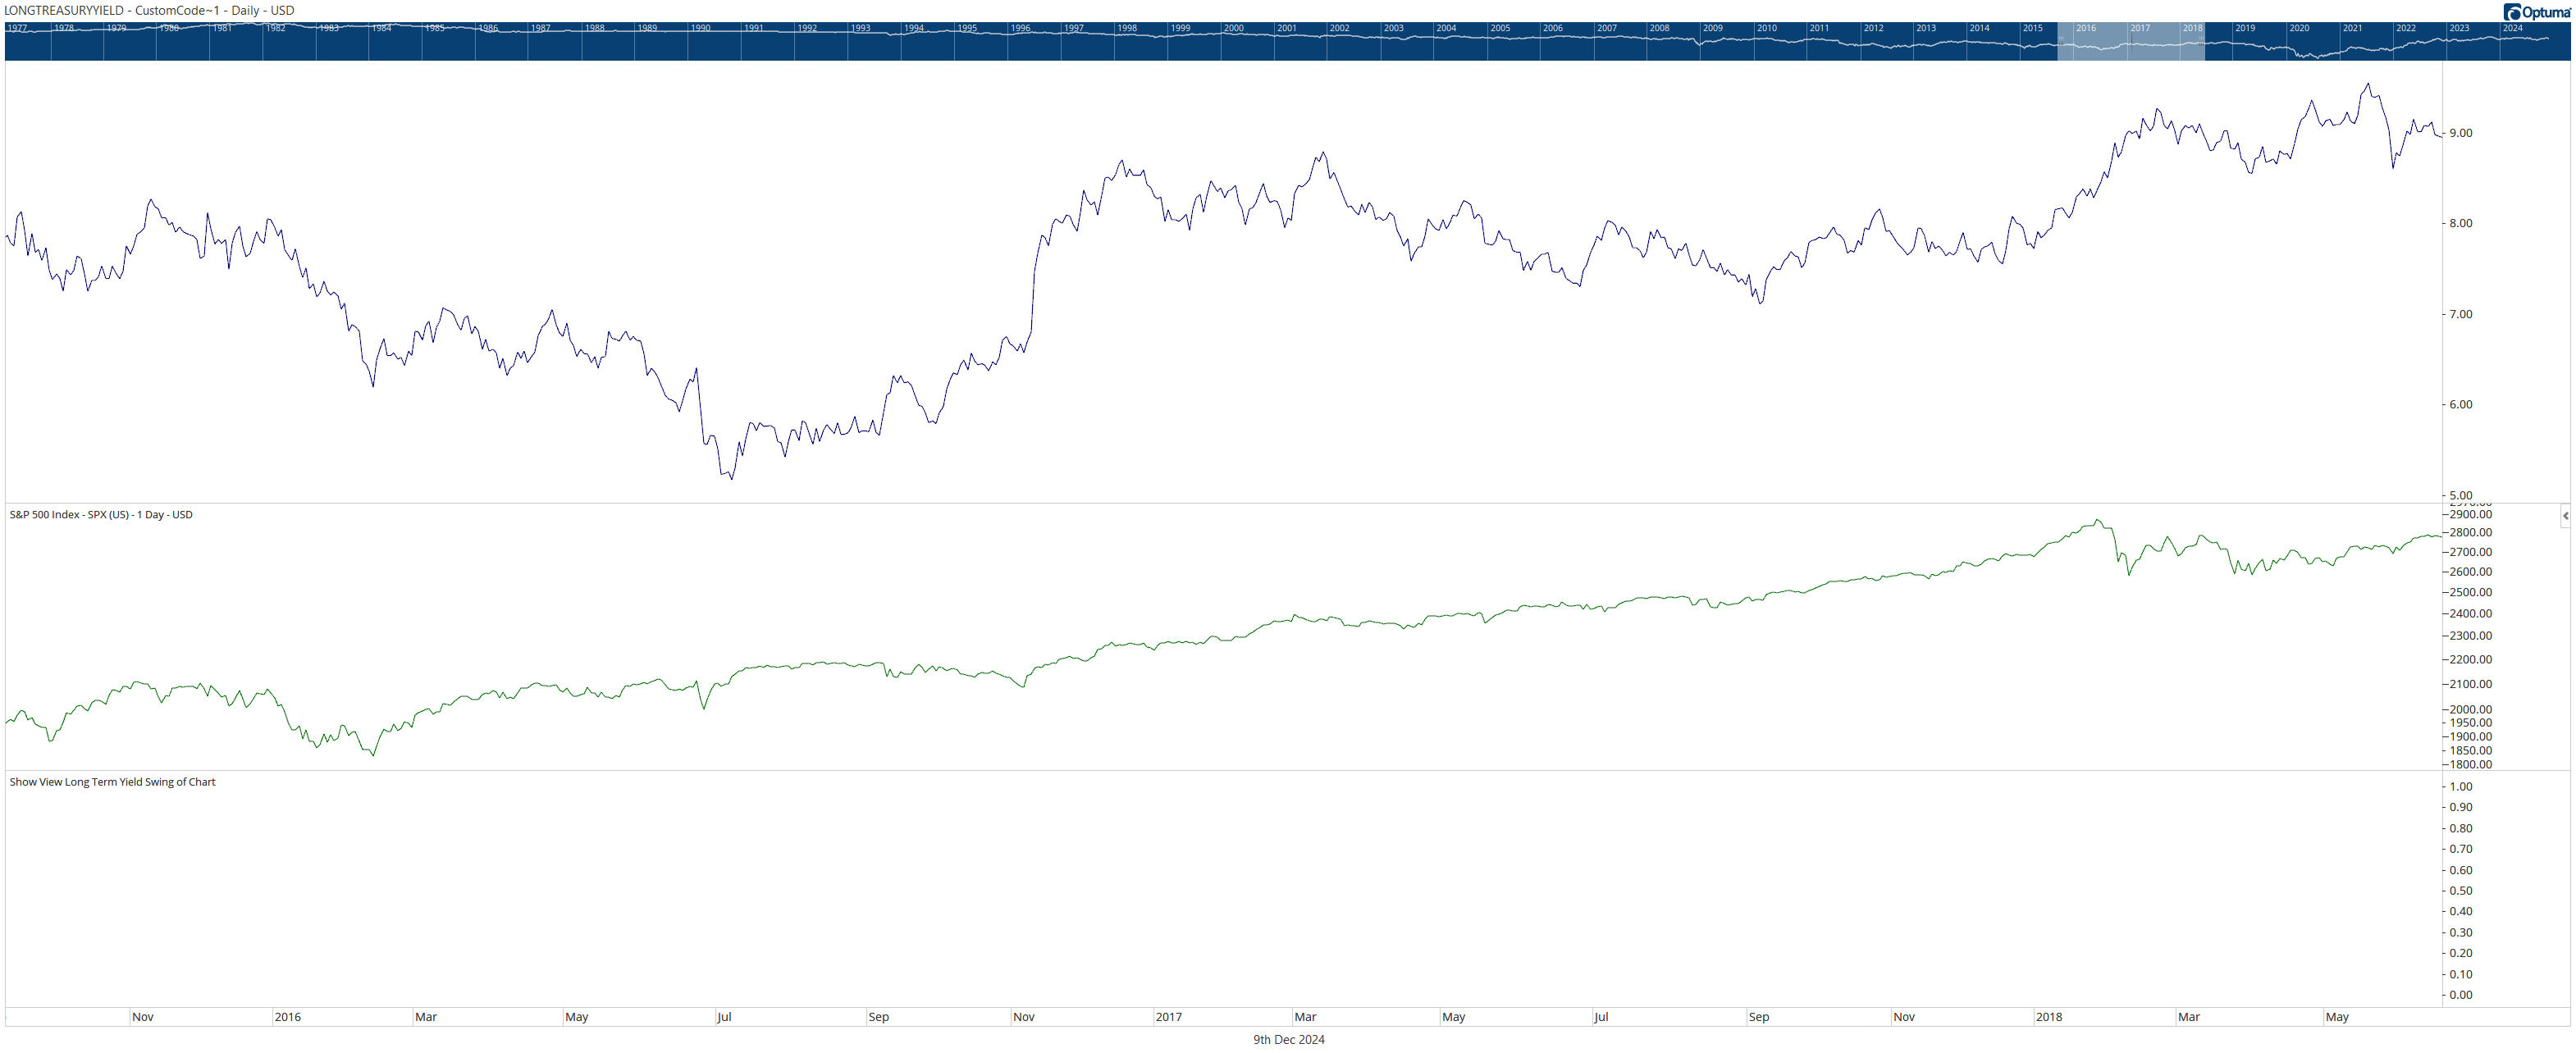
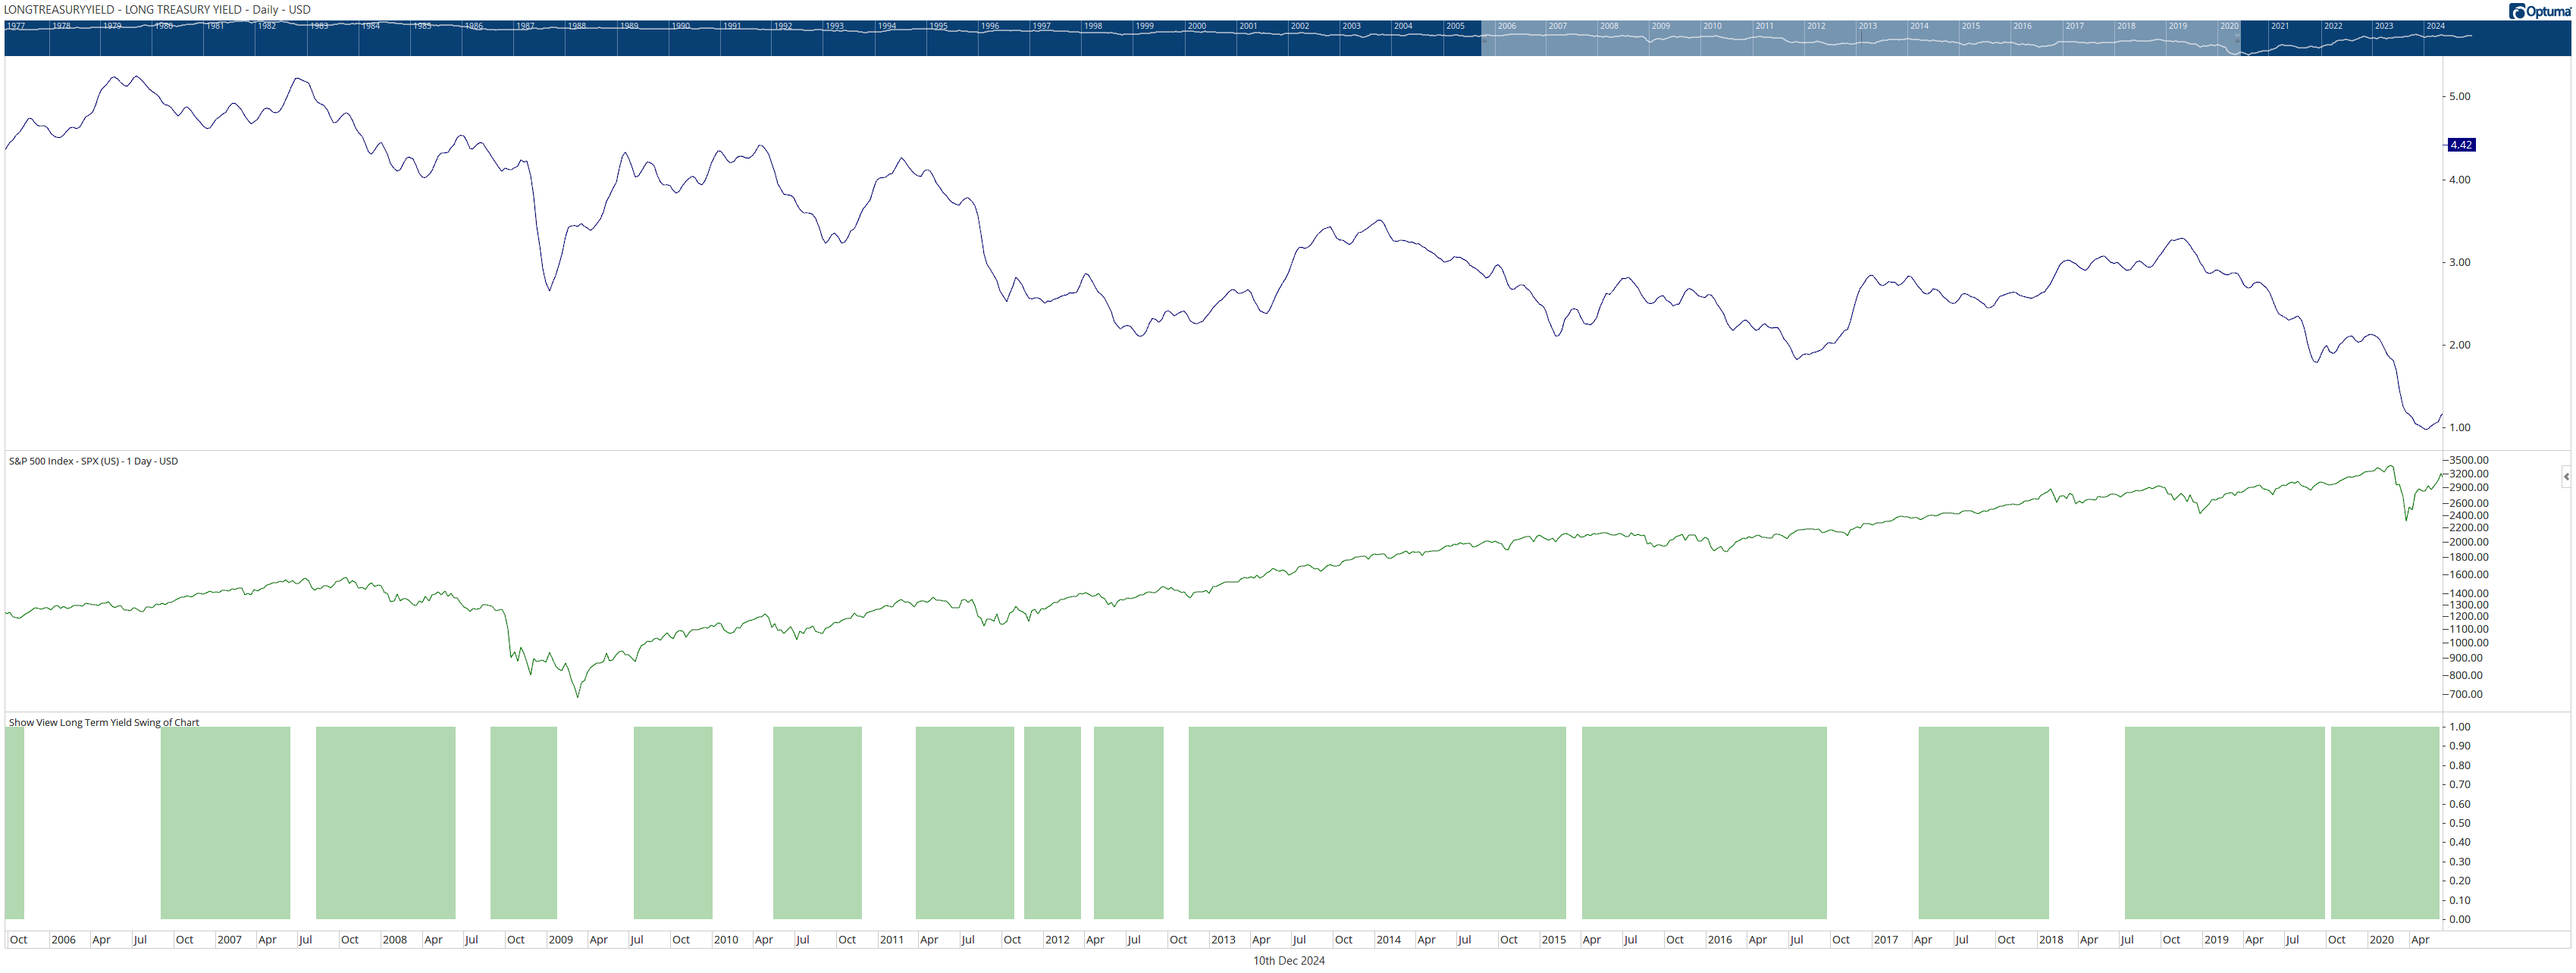
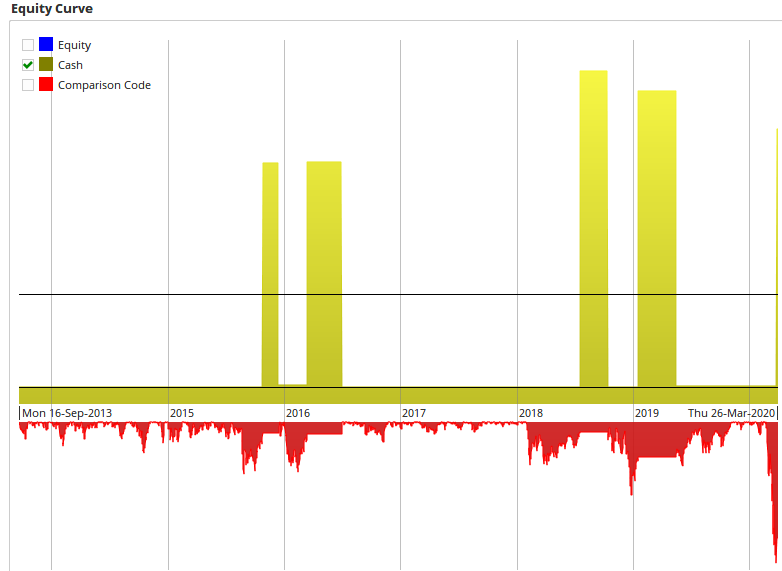
When I do the above and compare the ShowView below with the following code in the BackTester against SPX ( 2005 - 2022 ), I am holding cash at different times than the ShowView would indicate. Specifically in 2019.
This leads me to believe I am not representing the script from the ShowView correctly within BackTester.
Also, is there a way to display the PercentSwings in the top panel to verify the values? I only see one value option in Percent Swing Chart Overlay, but the high and low percentages are different in this case.
Scripting and testing with swings can be quite complex because of the underlying data exposed in the testing engine (for a detailed explanation see here).
However, I think the issue may be that you are using different swing lengths, so the 11% swing won’t turn down after every 5% move as the 11% swing may not have turned up yet…
To display both swing values on the chart you would need to apply the overlay tool twice, one using 5% and the other 11%.