I am having some trouble defining the correct script protocol for trend indentification of where a trend starts and then when to end the trend once its established. The logic is below:
To start the trend, the criteria would be defined as:
Low above 21-day EMA for 10 days
21 EMA over 50 SMA for 5 days
50 SMA is up
Close is up
Issue #1:
I am running into a challenge with Close is Up. The close only needs to be up on the one day when all the other conditions are true. Combined those conditions will start the trend.
//Set Variables
V1 = MA(BARS=21, STYLE=Exponential) ;
V2 = MA(BARS=50);
V3 = LOW() > V1;
V4 = V1 > V2;
//Set Criteria
R1 = BARSTRUE(V3) >= 10;
R2 = BARSTRUE(V4, LOOKBACK=5) >= 5;
R3 = V2 IsUp ;
R4 = CLOSE() > CLOSE(1) ;
//Find Where All Criteria Are met
R1 and R2 and R3 and R4
The Close being Up will only allow the script to pass if the other 3 criteria are also met on the same day.
For the exit trend, you can use bar variables to set the date based on the last time the trend start condition was met, and calculate the highest high from that point. Here is a script that should work for the exit:
Thank you Matthew! I would not have foreseen that.
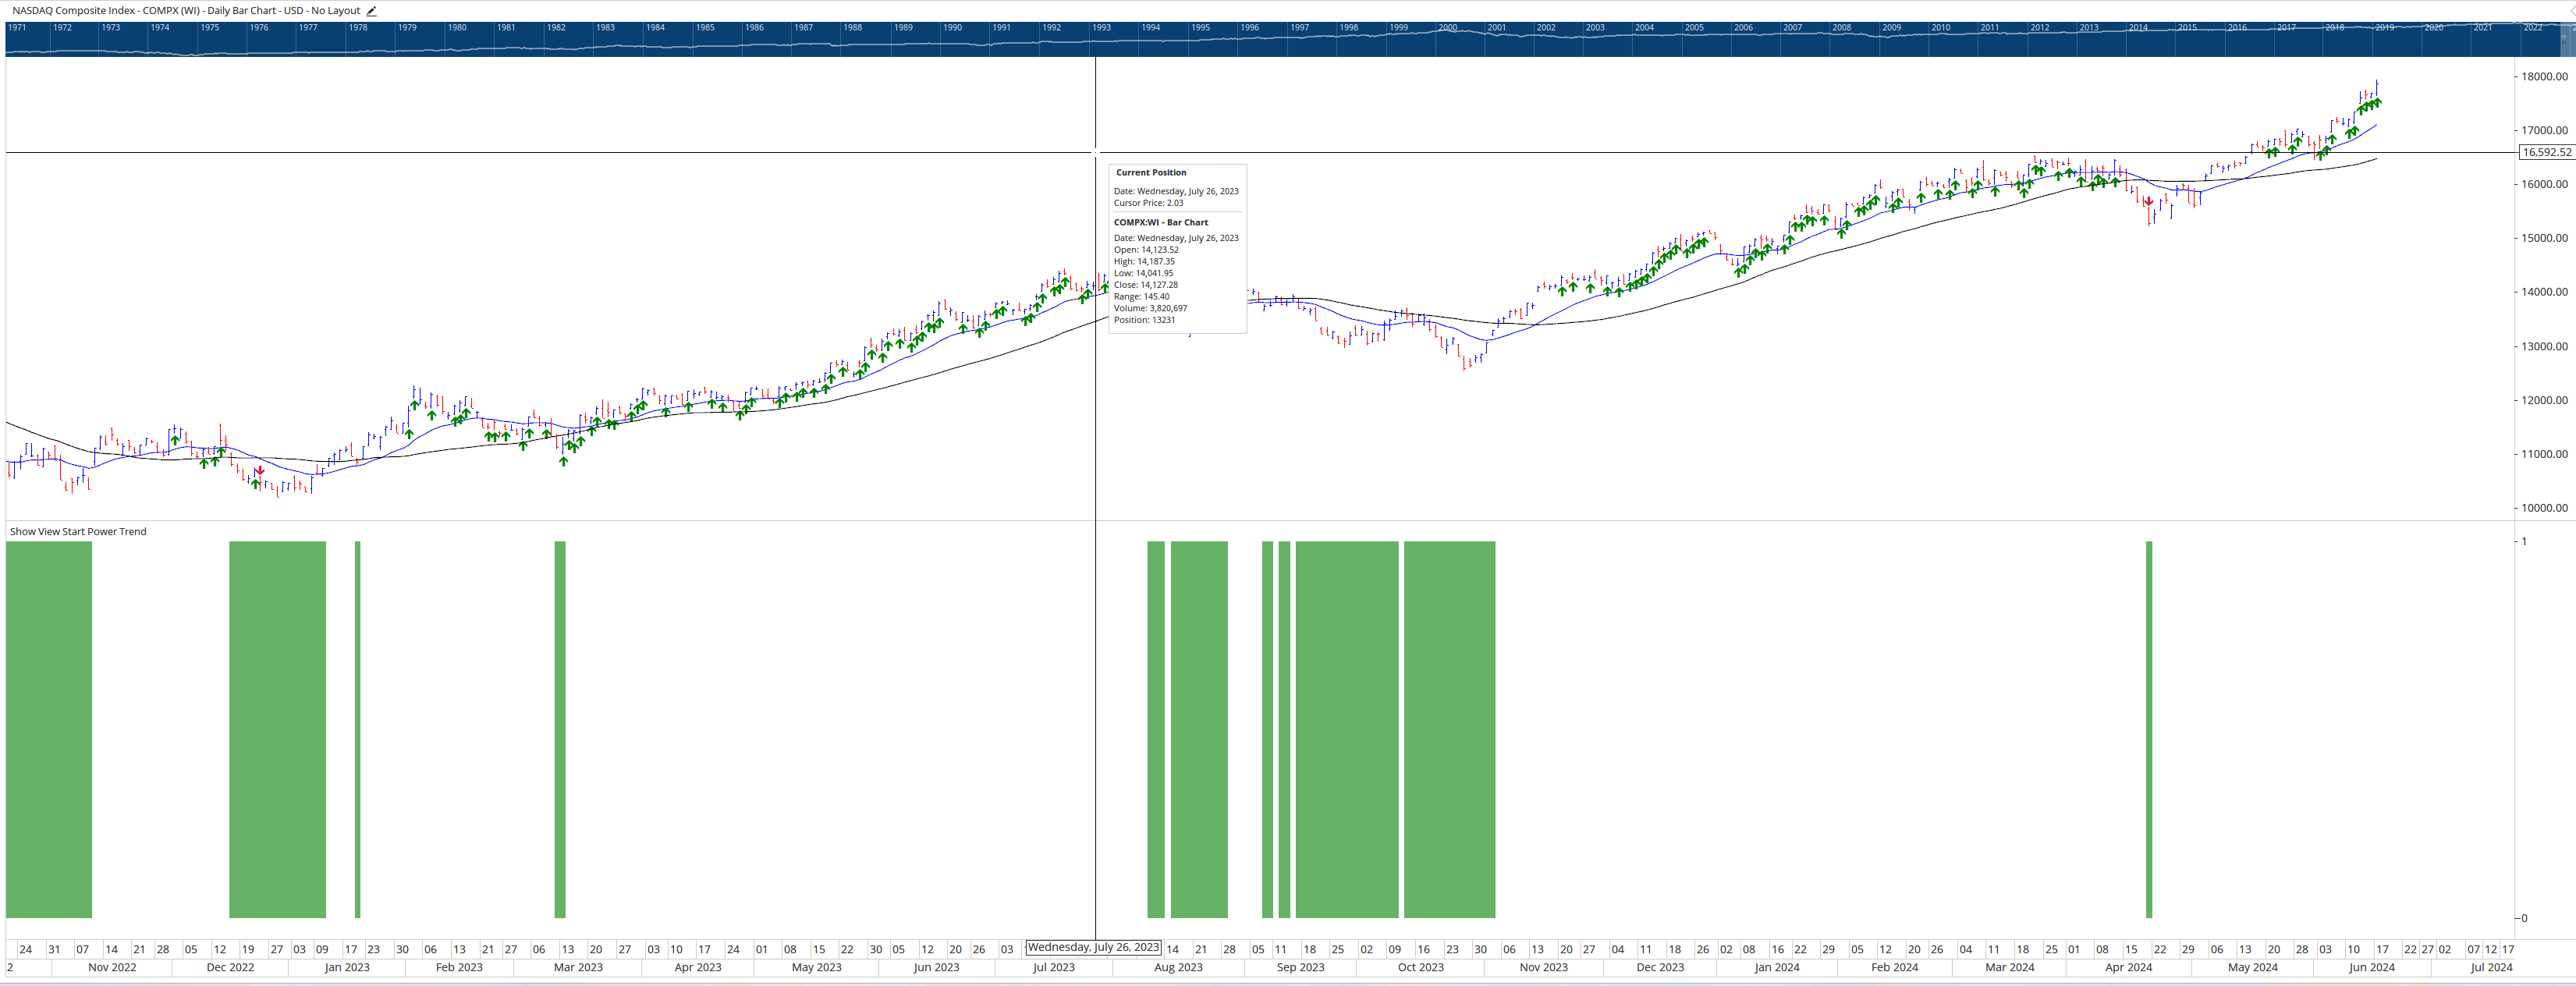
When I plot in a ShowView and isolate the signals in a ShowBar for the start and stop points, I get the attached. The ShowView and ShowBars do not appear to match.
I would expect the ShowView to be contiguous +1 when the trend starts and 0 when it stops and the isolated signals to match those start and stop points.
Am I misunderstanding how the the script operates?
For the Show View to work in the way you are describing you’d need to setup a Switch() at the end of the script. This would look for the first instance of the Entry criteria passing, then keep the result as 1 until the exit criteria triggers.