Hello,
I need help making a script that shows the letters P and S, like in the attached image:
Explanation:
- P means Monthly
- S means Weekly
Basically, when there’s a P, it shows the highest or lowest monthly price on the daily chart.
Thank you.
Hello,
I need help making a script that shows the letters P and S, like in the attached image:
Explanation:
Basically, when there’s a P, it shows the highest or lowest monthly price on the daily chart.
Thank you.
Hi Nurdi,
Do you have a formula? If P is monthly why isn’t there a P for every month? And how do you determine whether it’s on a high or a low?
Let me try to explain.
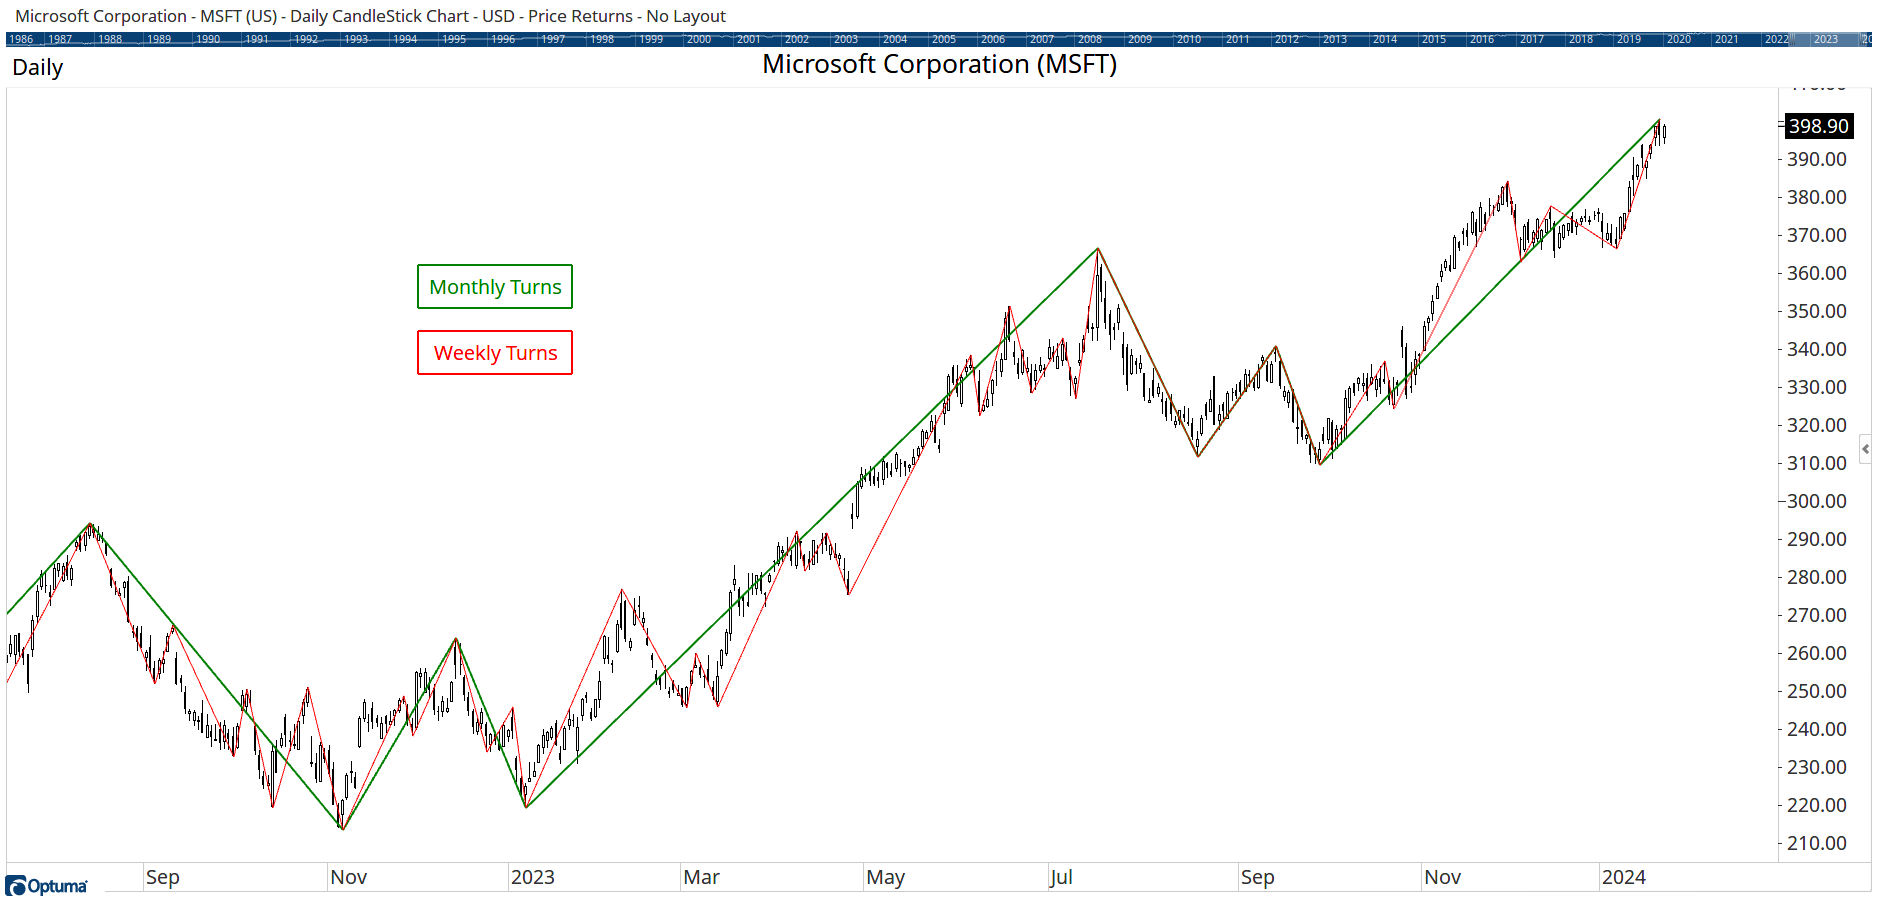
In the picture below, P is the monthly turning point
If the market goes up and makes a higher high, we place P at the highest point of the higher high.
If the market goes down and makes a lower low, we put P at the lowest point of the lower low.
Hi Nurdi,
I think we can do something similar using weekly and monthly Gann Swings overlaid on a daily chart. Use the following in two separate Show Plot tools to show the monthly turns (in green) and weekly in red:
V1=MONTH();
GANNSWING(V1)
Weekly:
V1=WEEK();
GANNSWING(V1)
Does that do what you need?
Yes, I think so.
Thank you.
Hi Darren,
Does OPTUMA have built-in indicators (instead of custom scripting) for weekly, monthly, and quarterly swings?
Hi Nurdi,
We have 4 swing overlay tools based on Gann, Price, Percentage, and Volatility (ATR moves), but none based on time. Pivot Labels are based on bar counts.
Hey Darren,
I hope it could become a standard indicator. ![]()
Hello Darren,
Can you help me with the Quarterly and Yearly script? Thank you.
Hi Nurdi,
Change the V1 variable to whatever timeframe you require, eg MONTH(PERIODAMOUNT=3) for quarterly and YEAR() for yearly.
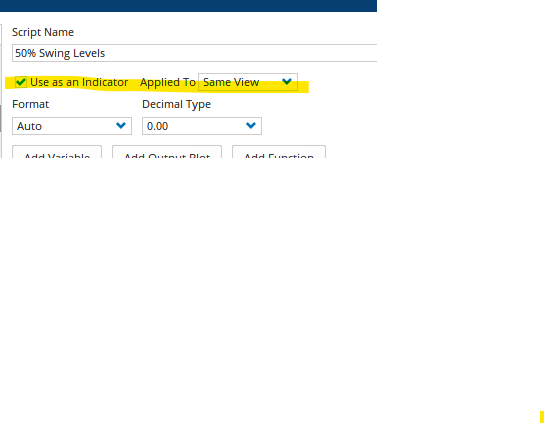
You can save each script as an indicator to be applied to the same view (ie the price chart) so they get added to your toolbox, as per this example.
Hello,
I did it
Thanks
Hello Darren,
I would like the swing to display the date, range, calendar days, and trading days for each swing. (with the font size=14)
Could you assist me with the coding, please?
Thank you.
Hi Nurdi,
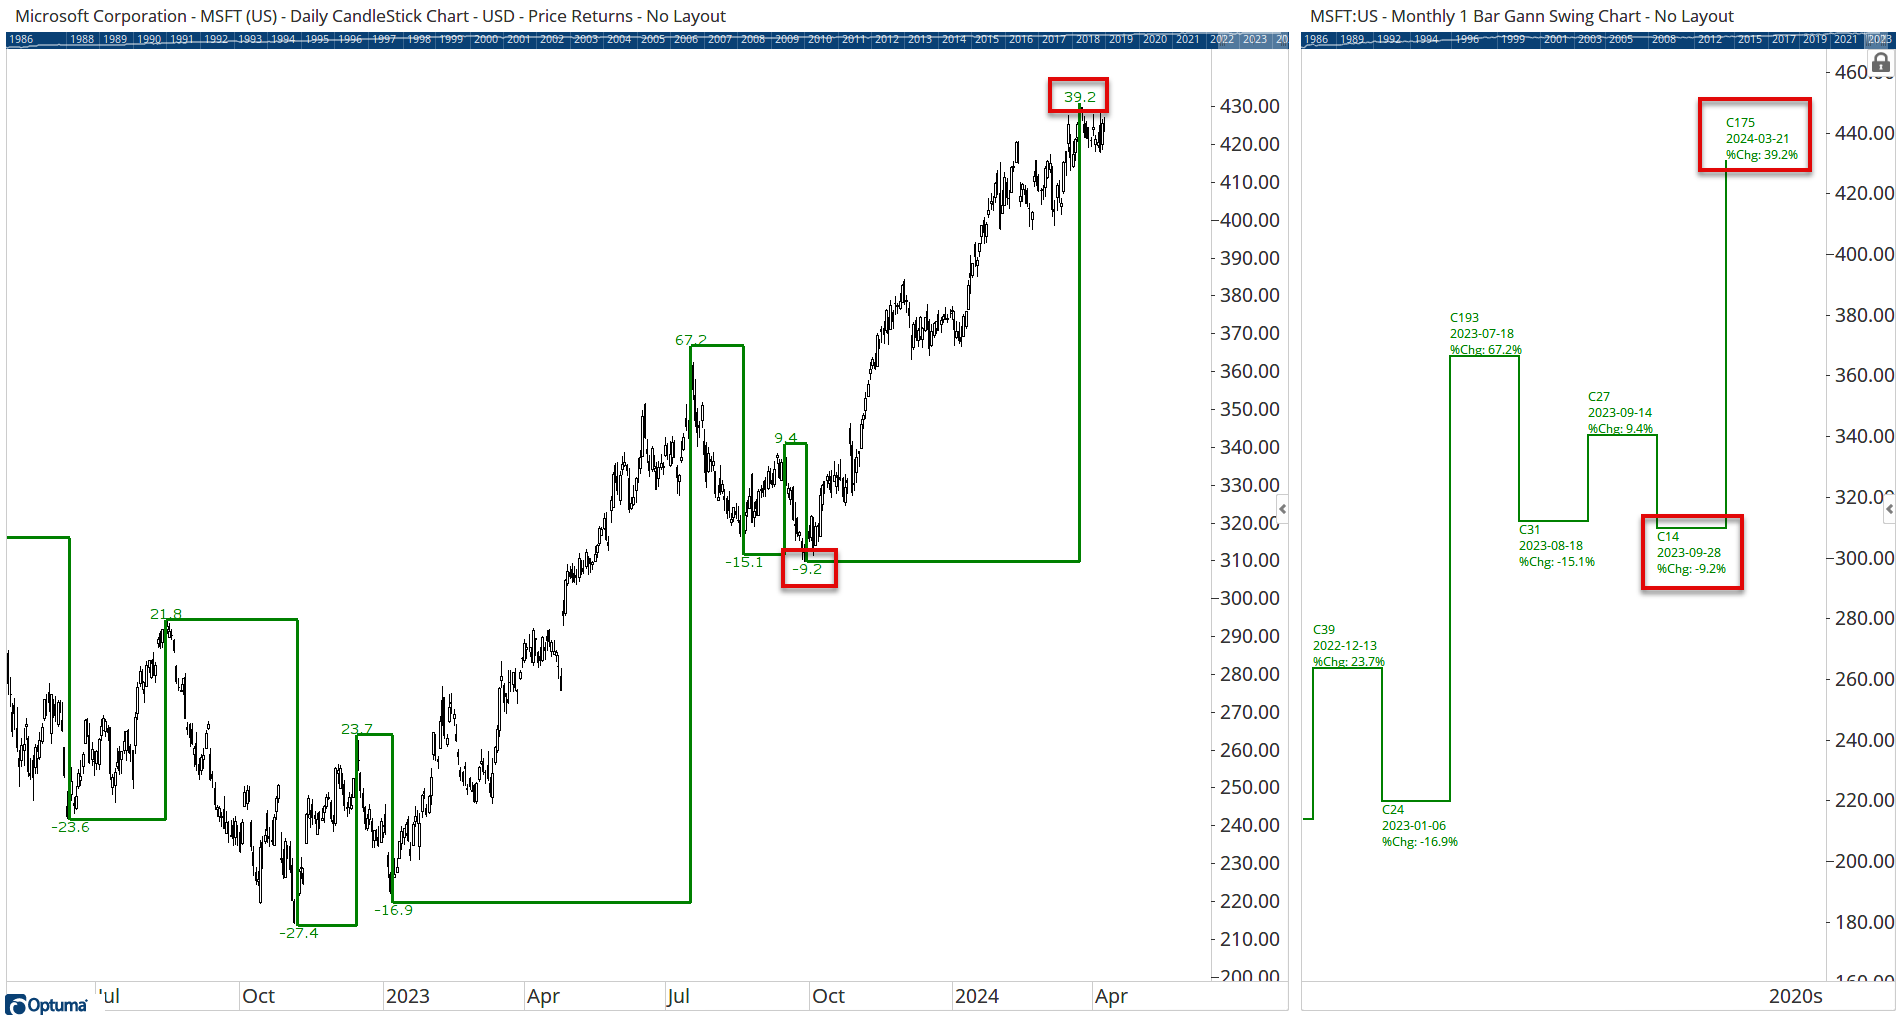
Only the range label can be easily scripted using a Show Bar set to display a number. This is for the range % of the monthly swing up:
V1=MONTH();
V2=GANNSWING(V1);
//If the high price is the same as the swingend, display the % diff;
IF(HIGH()==SWINGEND(V2), DIFFPCT(SWINGEND(V2),SWINGSTART(V2)), MISSING())
For the swing down:
V1=MONTH();
V2=GANNSWING(V1);
//If the low price is the same as the swingend, display the % diff;
IF(LOW()==SWINGEND(V2), DIFFPCT(SWINGEND(V2),SWINGSTART(V2)), MISSING())
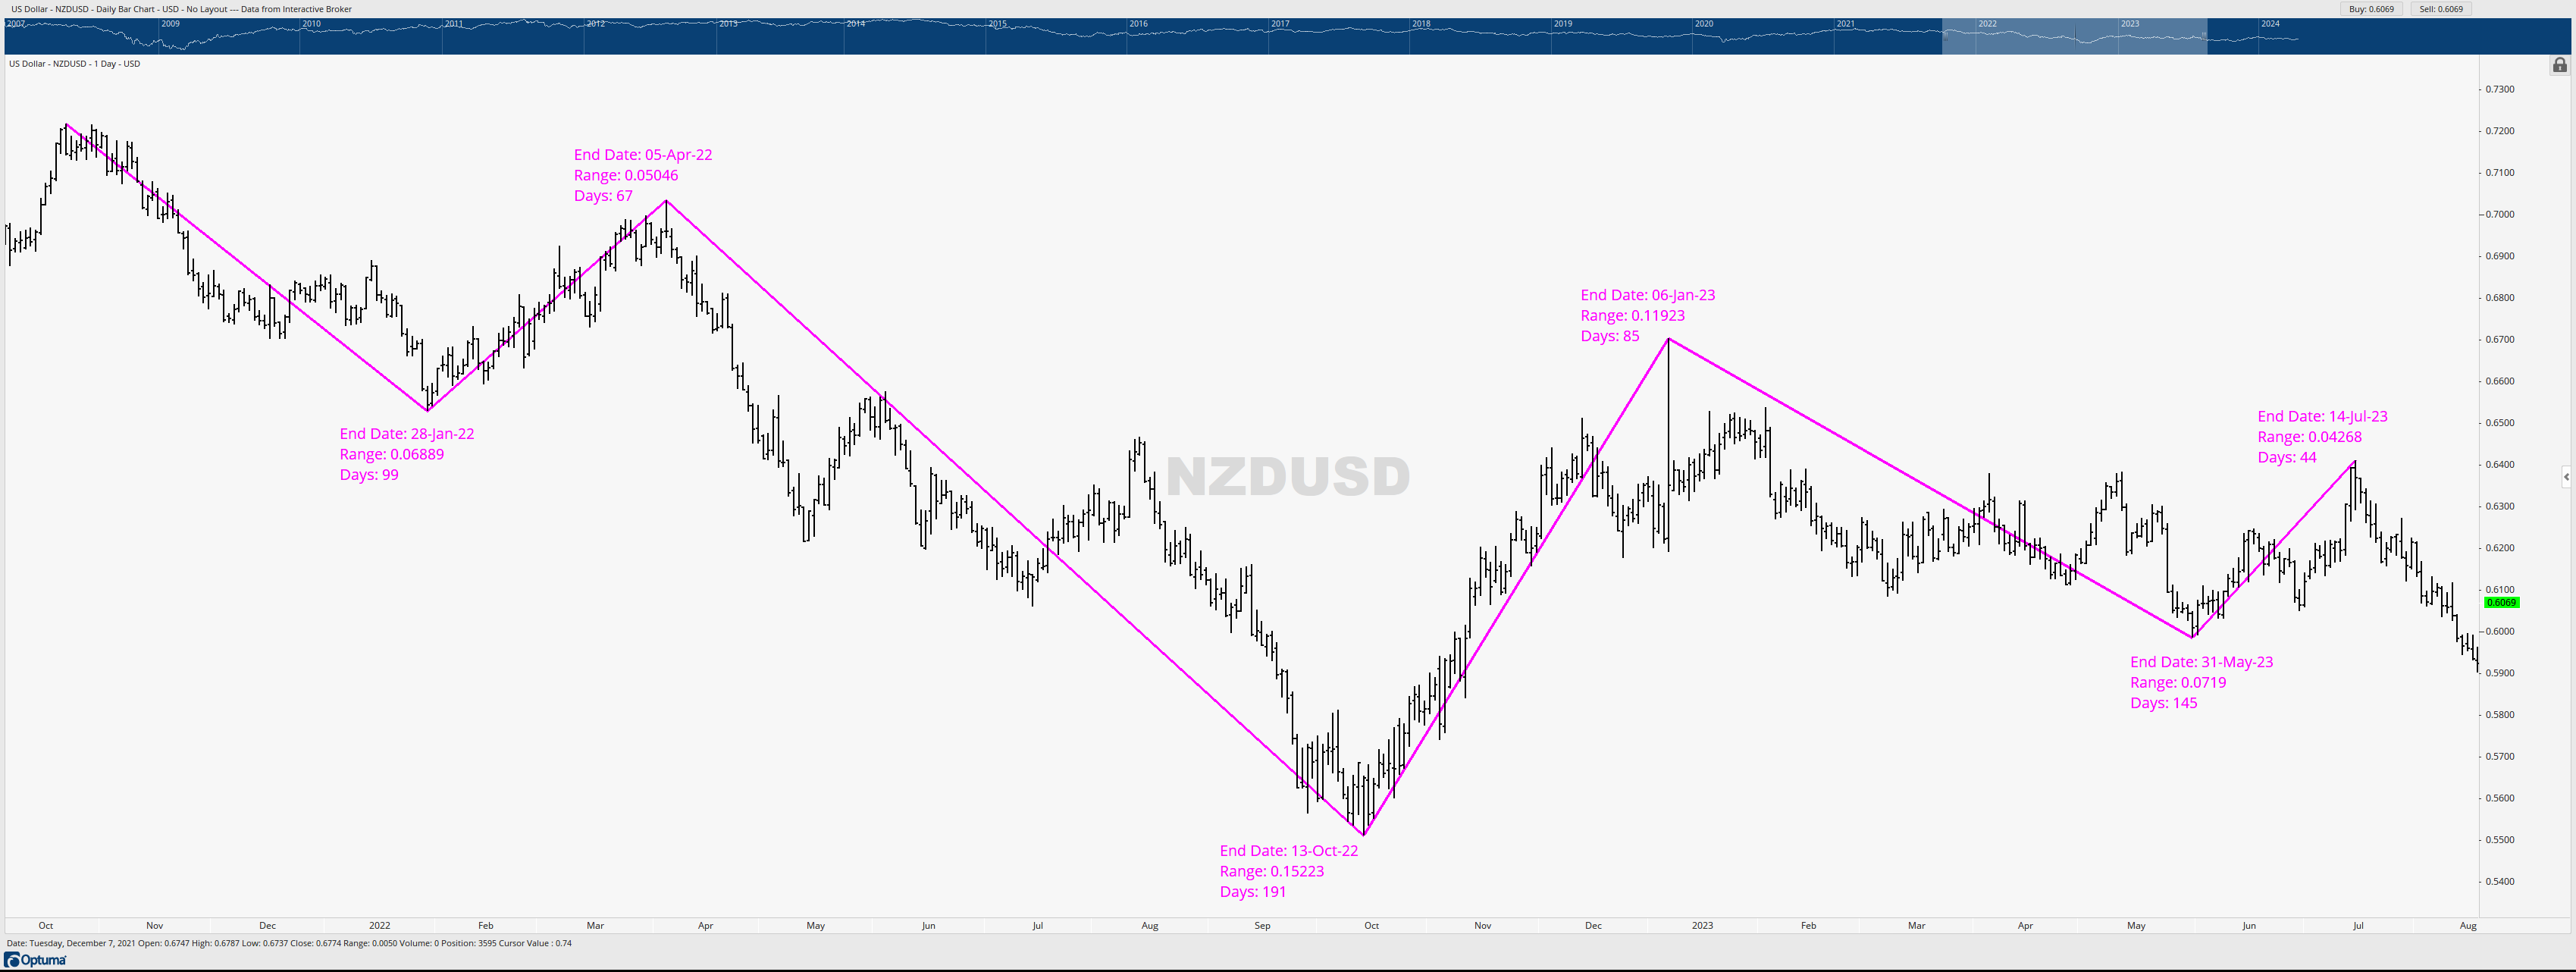
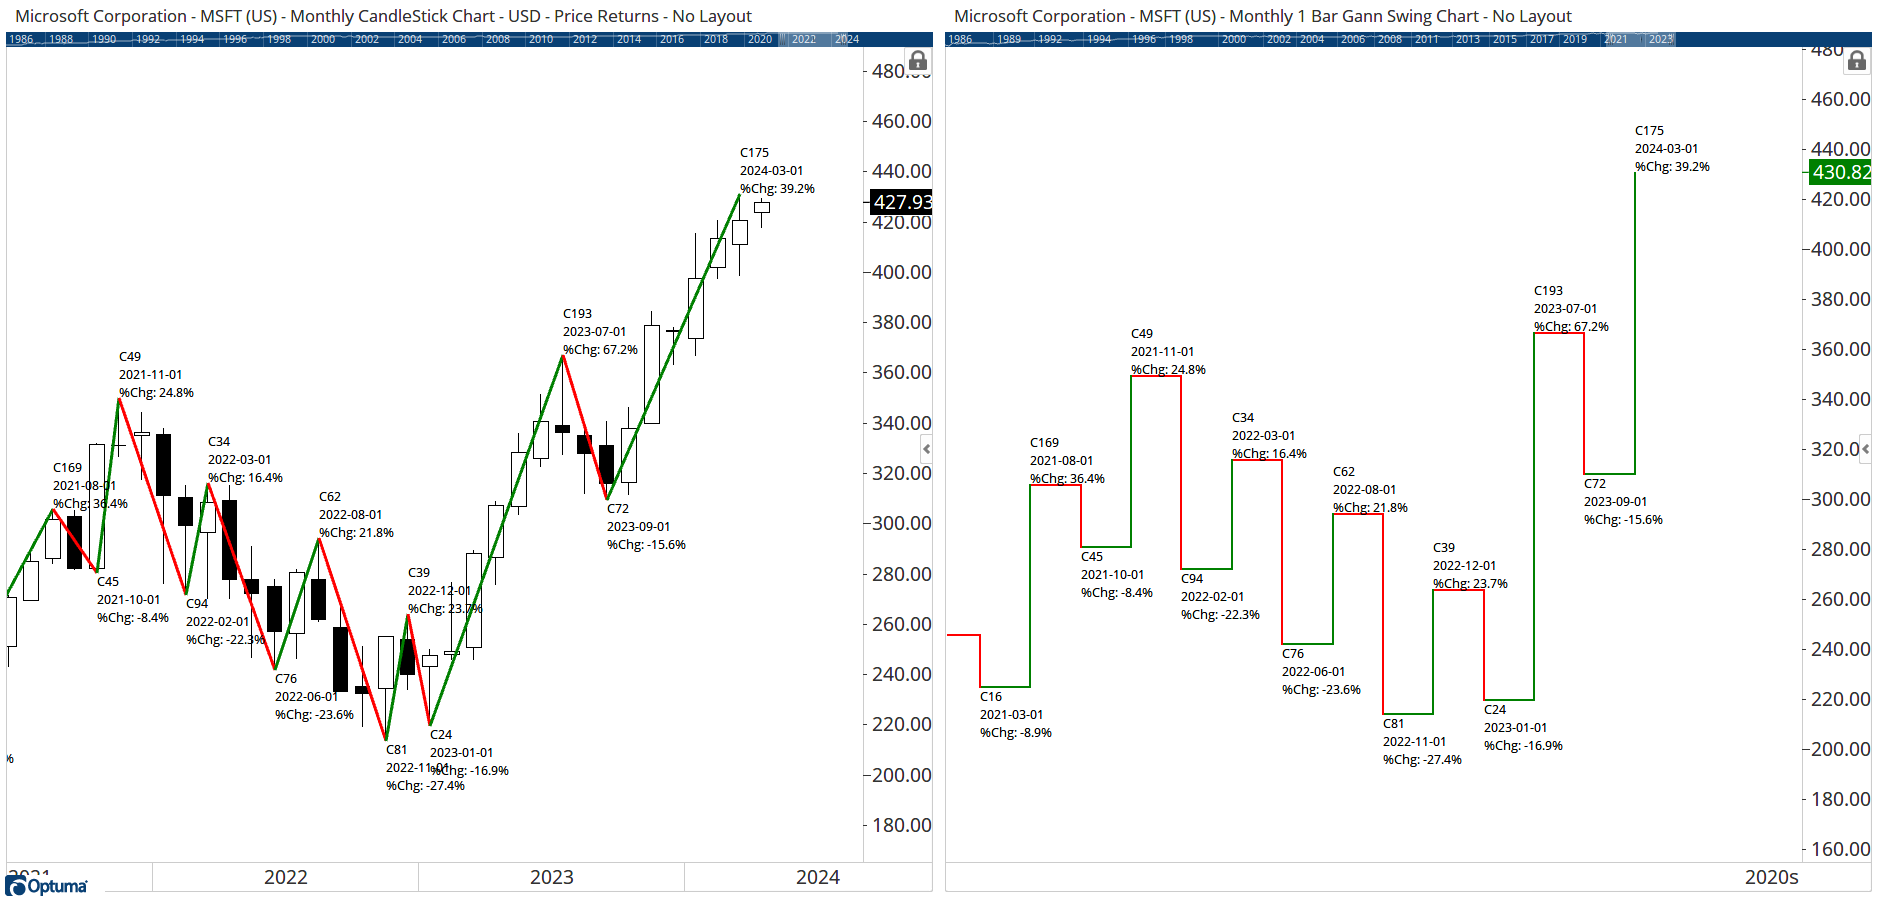
The only way to see the date and calendar days would be to show a monthly Gann Swing chart beside the price chart with the labels enabled, as per this example. The current monthly swing for MSFT started 175 calendar days ago (Sept 28th) and the % range from low to high has been 39.2% (matching the Show Bar label on the price chart). The previous swing down was -9.2% which only lasted 14 calendar days. Workbook attached.
Monthly Swing Turns.owb (19.2 KB)
Hi Darren,
Thanks for helping out.
I want to do something like the picture with just one click. Right now, I draw the Gann swing with a script(one click) and then draw Time Price Measure for each swing(many times clicking). Can we simplify it to just one click?
Thanks!
Unfortunately not. The labels can only by automatically added on the monthly Gann Swing Chart or the Swing Overlay tool:
Hello Darren,
Thanks for the help. I’m wondering if there’s a way to display the last bar date, range, and total number of swings on the show bar.
Cheers
Hi Nurdi,
Not that I can think of, as the Show Bar was designed to highlight true / false conditions, and not for labels.