Hi There.
For the life of me I cannot seem to get a good graph of the US treasury bonds. Which has any meaningful data or time history.
Such as the $UST10Y or the $UST1Y
I’d like to build a US YIELD CURVE chart and have as much history or data as possible.
Thanks for anyones help.
https://www.cnbc.com/quotes/?symbol=US10Y
Okay, may have resolved.
Just had wrong data set perhaps.
Awesome.
Hi Jonathan,
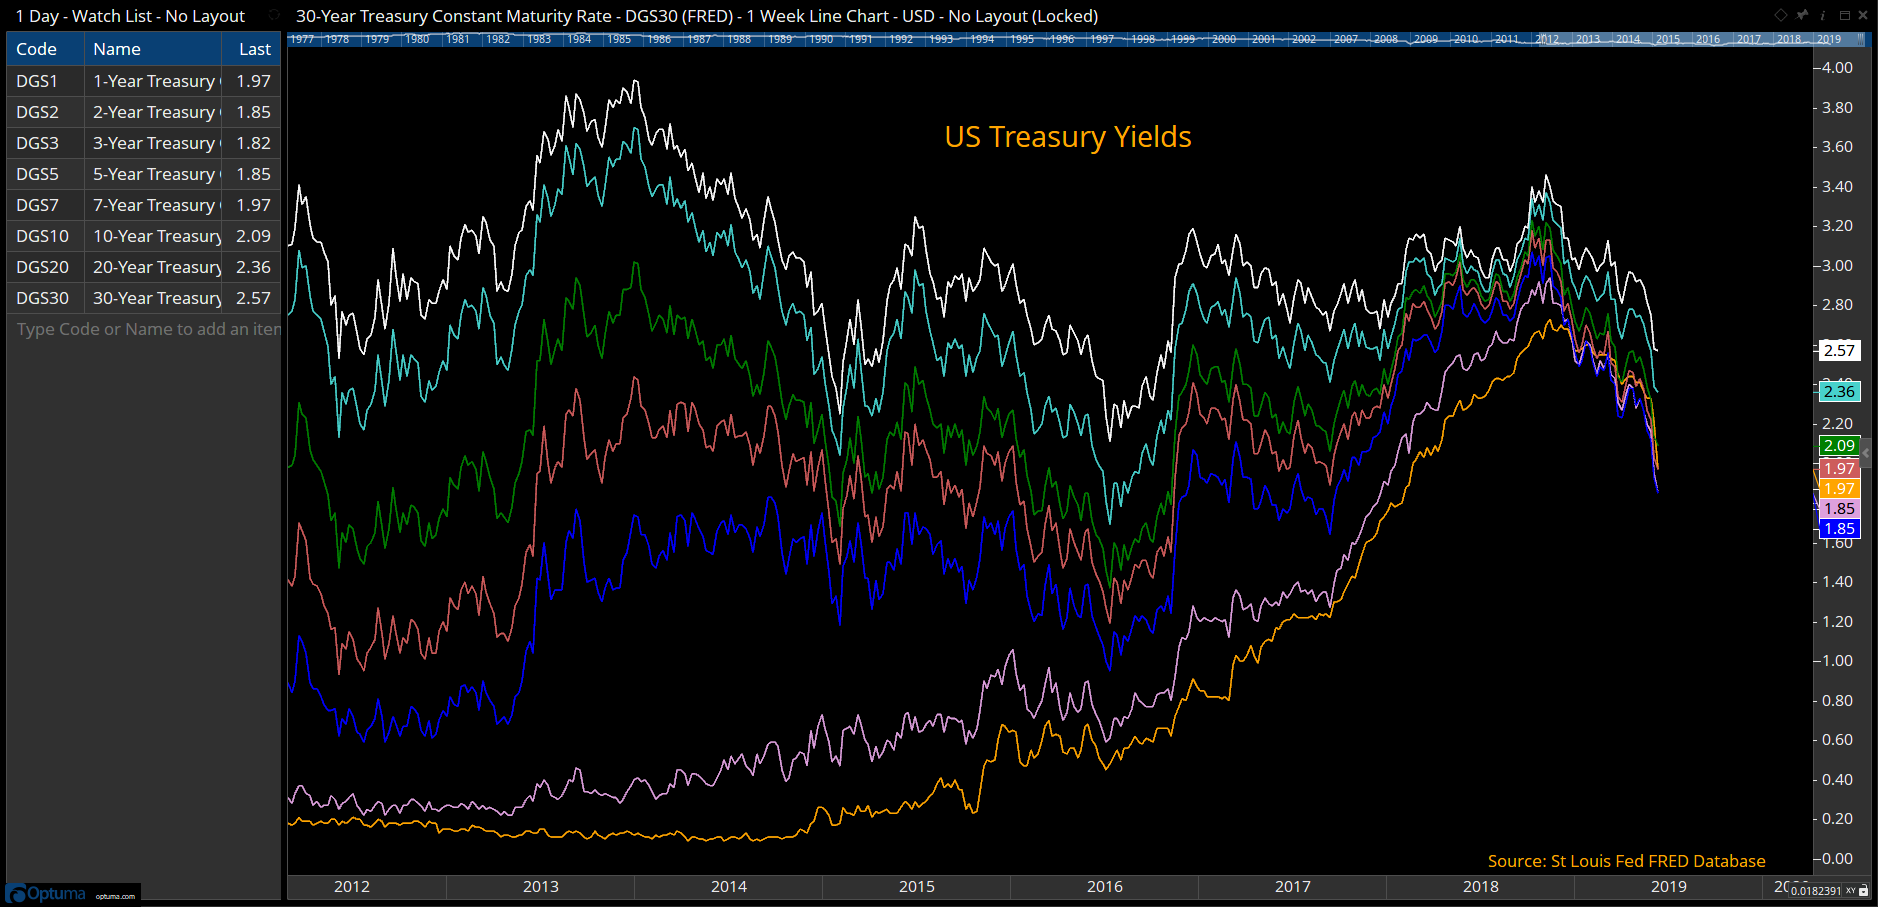
For the US data you can use the data from the FRED Federal Reserve database, eg DGS30 for the 30 year, or T10Y2Y for the 10-2 spread:
Using the FRED Database
Save and open the attached workbook file to open this chart:
FRED-US-Yields.owb (64.7 KB)