I have a question about the Master Currency feature in the settings of a Watchlist. If I select USD as the Master Currency for the watchlist, does this mean that any scripts or data I pull in that watchlist will all be converted to that Master Currency? For example, if I ask for an 30 week Exponential MA, will the result be based on the USD underlying values, even if the security I am applying it to is based in GBP? Similarly, if I then ask if that EMA IsUp, will the result be based on the USD values of the EMA, even if the base currency for the security is GBP?
Hi Mike,
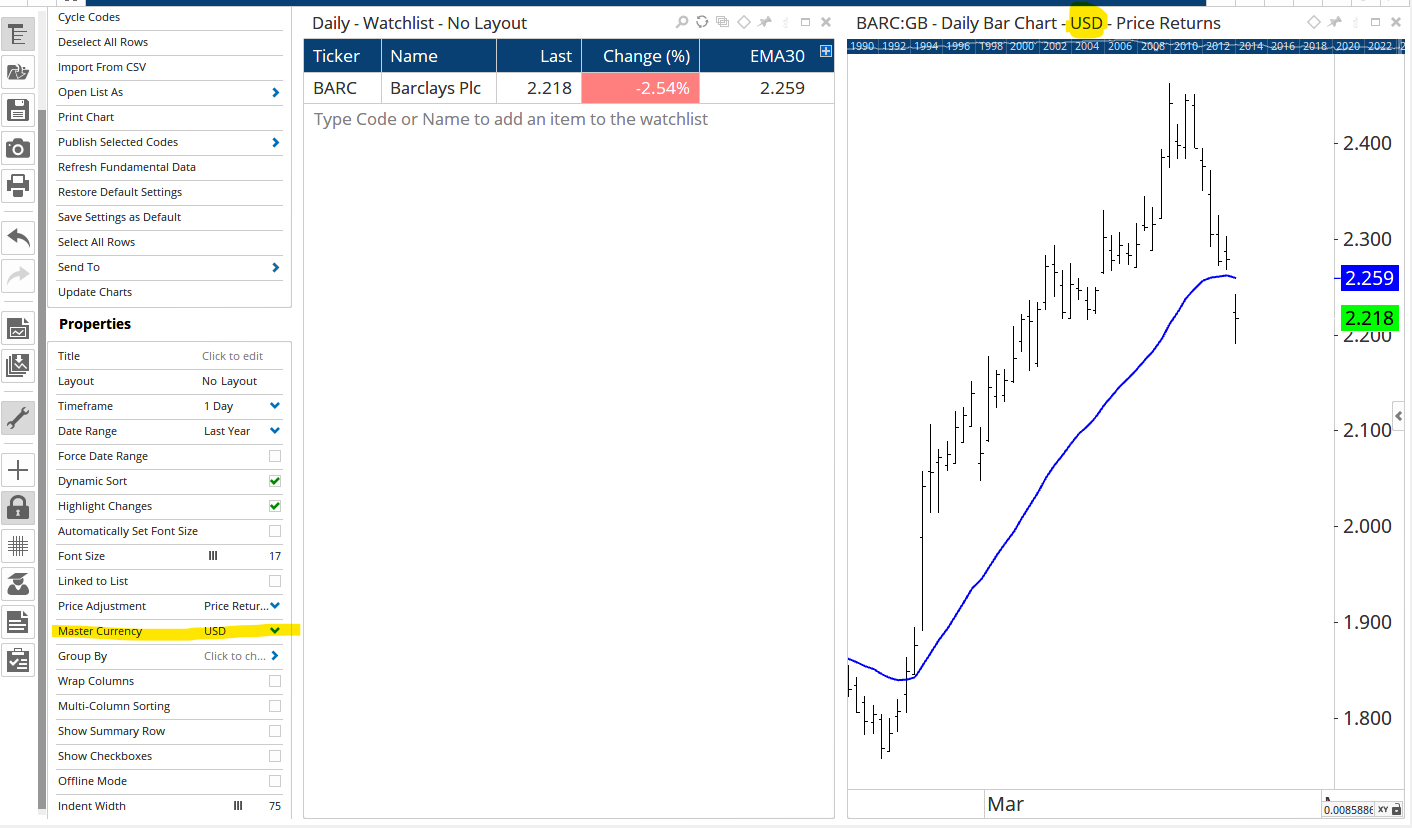
When the Master Currency is changed in the watchlist then all the column calculations are based on the converted price. So in this example for Barclays, the GBp price is converted to US$2.218 and the EMA30 is 2.259, which matches the converted chart below.
However, I have noticed that when changing the watchlist to a weekly timeframe that the converted EMA value remains daily, so until we get that fixed you would need need to use the following to show the correct weekly EMA value:
MA(Week(PERIODAMOUNT=1), BARS=30, STYLE=Exponential, CALC=Close)
Thanks Darren - I think I have been using that formula for the EMA but this does make some sense as I have also been trying to use the Offset function to assign upward or downward slope and have been getting some spurious results i.e. visually I can see on the chart that the MA vs offset MA should be positive i.e. “true” but that the script returns a “false” reading. I’m guessing this might be because even though I am specifying weekly or the watchlist is weekly, it is actually looking at an offset using daily values? Do you think that is the issue?
Separately, I did try to use IsUp and IsDown for the same EMA. I was then trying to combine with Close vs MA in an IF function. What was surprising was that the correlation between IsUp and Close>MA was 100% and likewise was also 100% for IsDown and Close<MA. This was for a sample of over 100 securities. Does that seem surprising to you? Is it something to do with how IsUp and IsDown is calculated? Any thoughts here would be useful.
Thanks, Mike
Hi Mike,
If you can send your workbook to [email protected] we’ll take a look, but the watchlist should match the charts.
Also, the IsUp and IsDown conditions just the last value with the previous value, and even if it’s 0.000001 higher or lower then they will display as true.
The Close > MA being the same as IsUp for all does seem strange, but I’ll advise when I see your workbook and formulas. Thanks!