Hi Guys
I’m trying to get a watchlist script column to show when price approaches a recent SwingStart. Something like the code below… however it doesn’t seem to work as expected. Am I misunderstanding something?
sd1 = BARROSSWING(Day(PERIODAMOUNT=1), DEFAULT=Initial, INITBARS=9);
b1 = SWINGSTART(sd1);
b2 = SWINGSTART(sd1,1);
b3 = SWINGSTART(sd1,2);
bx= CLOSE() > 0;
p1 = WITHINRANGE(CLOSE(), b1, PERCENT=0.25);
p2 = WITHINRANGE(CLOSE(), b2, PERCENT=0.25);
p3 = WITHINRANGE(CLOSE(), b3, PERCENT=0.25);
bx and (p1 or p2 or p3)
Oddly, the script seems to work if used to custom-colour format the candlesticks, but the watchlist gives erroneous results. Measuring the distance from the current close to the current swingstart doesn’t agree with the true/false result in the watchlist.
All the best
Jonathan
Hi Jonathan,
Can you share what swings you are trying to compare? If you can insert an image (the button next to the <> Code button above) that will help. Note that when the current swing is down then the swing start (ie b1) will be a high, b2 will be the prior low, and b3 the previous high. When the current swing is up then it will be the opposite, ie b1 will be a low, etc. As such, I think having all 3 within 0.25% would be a rare occurrence…

Hi Darren
Thanks for getting back to me. Even with my cryptic request, you managed to push me in the right direction.
Essentially I just want the watchlist to show if the closing price is getting close to any one of the recent swing starts on a specific timeframe. So if trading the daily chart, it would interesting to see price at or near one of it’s recent swing points, should it get back there.
Your table got me thinking, so I approached it a slightly different way which seems to work (I think!)
w1 = BARROSSWING(Week(PERIODAMOUNT=1), DEFAULT=Initial, INITBARS=9);
w2 = ((CLOSE() - SWINGSTART(w1)) / CLOSE()) * 100;
w3 = ((CLOSE() - SWINGSTART(w1,1)) / CLOSE()) * 100;
w4 = ((CLOSE() - SWINGSTART(w1,2)) / CLOSE()) * 100;
w5 = ABS(w2) < 0.5;
w6 = ABS(w3) < 0.5;
w7 = ABS(w4) < 0.5;

w5 or w6 or w7
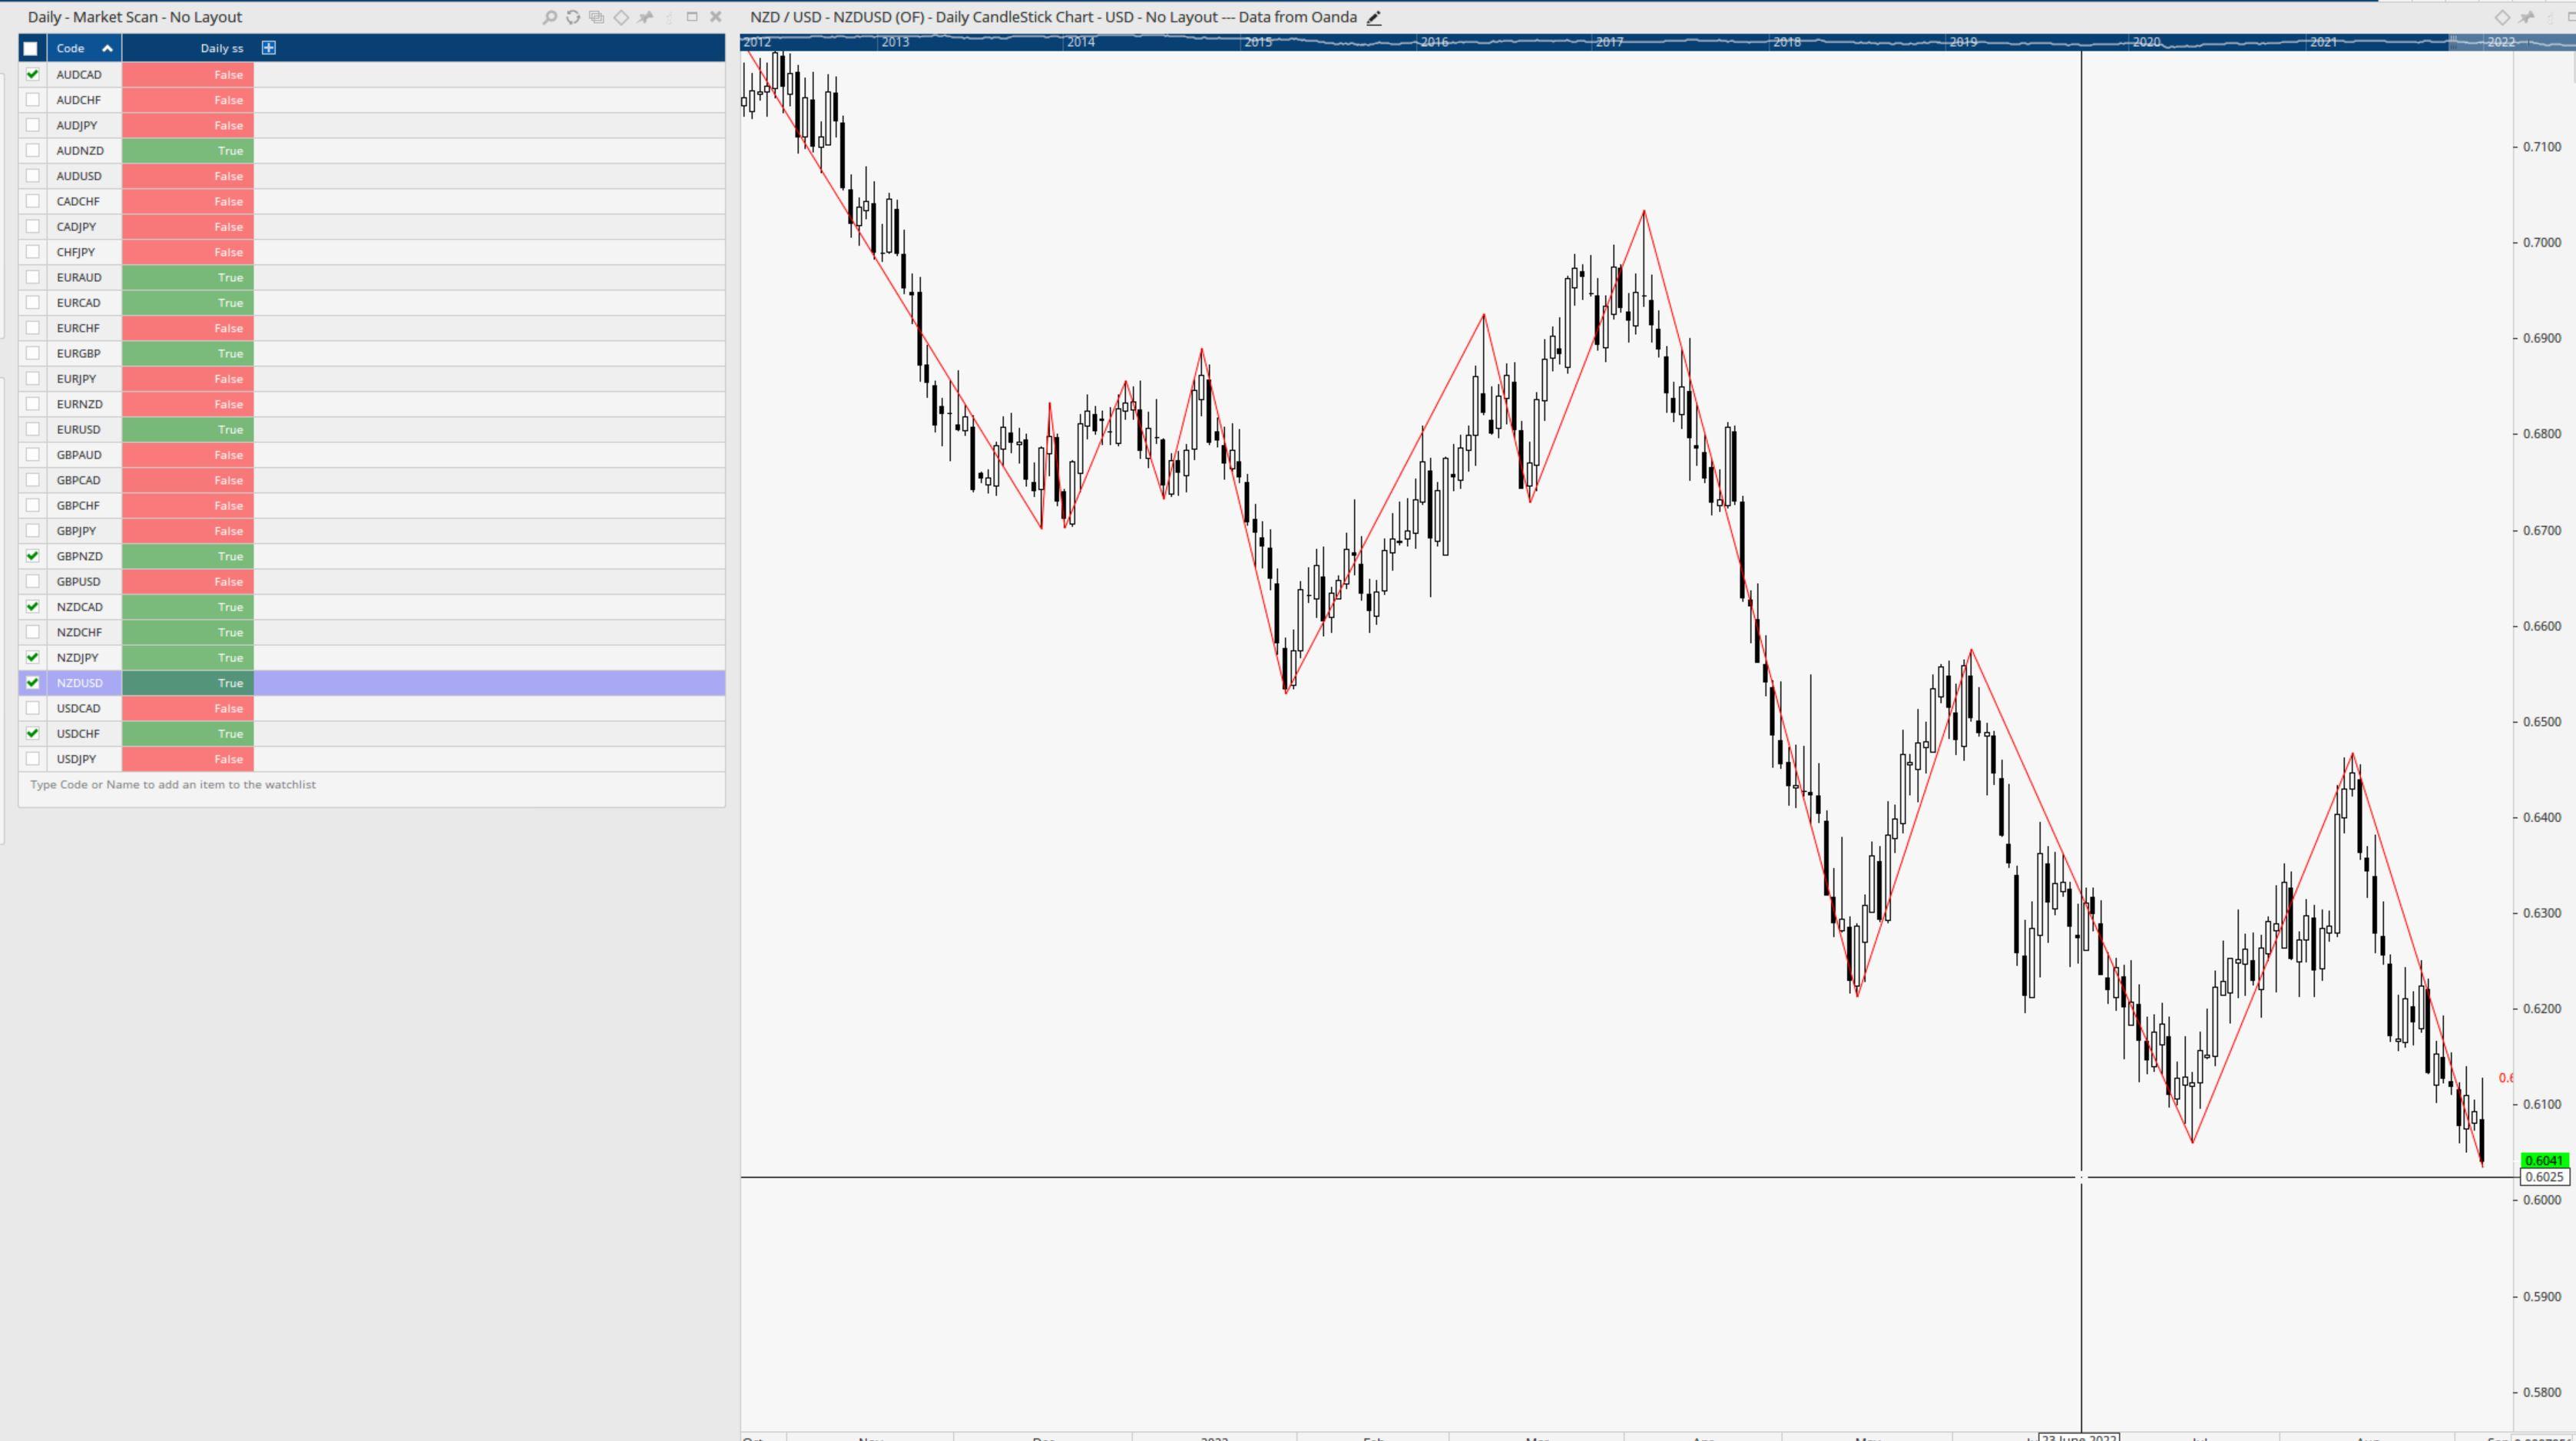
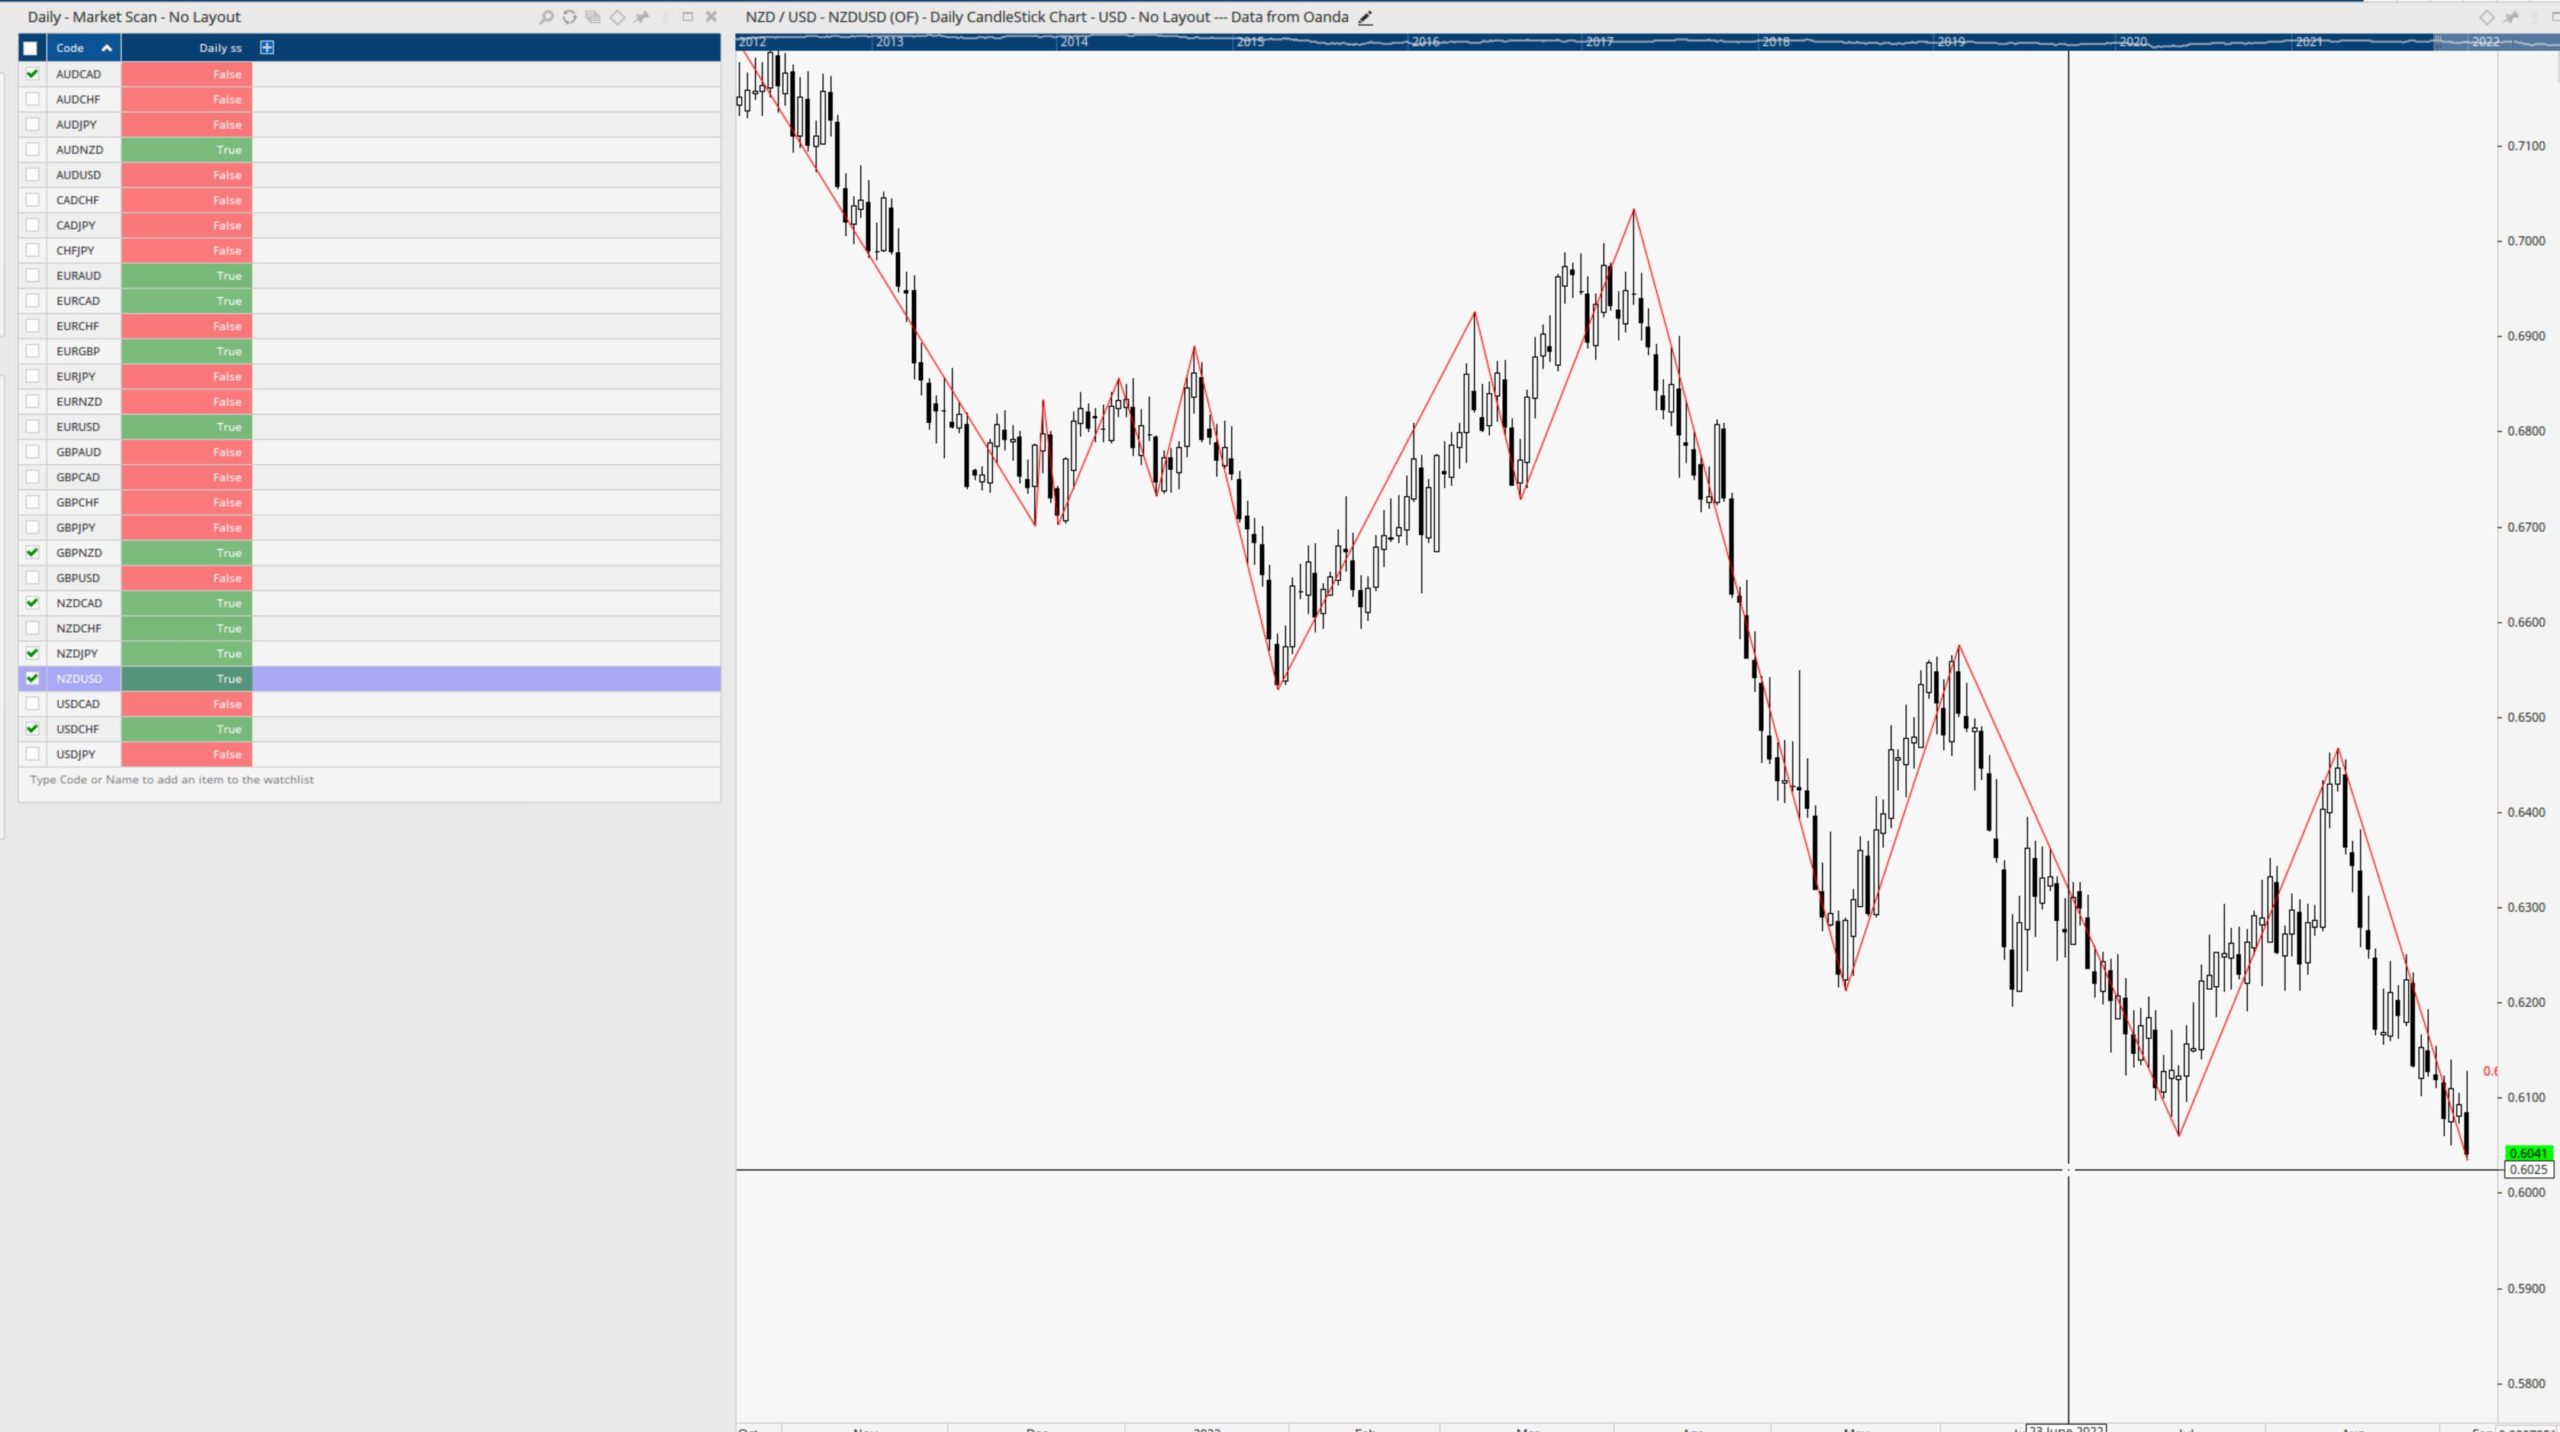
Have attached a screenshot, showing price near to a recent swingstart to show what I mean.
One odd quirk that I noticed, was that after a while the script column went ‘out of sync’, showing all rows as true. I found if I open/close the workbook, or toggle timeframe of the watchlist, it ‘reset’ to the correct values. That was when I was viewing the column on a 60 minute setting. Any idea why that would be?
Thanks again
Jonathan