Can I specify the year in a column with YTD Performance. I want to run a scan for best performers annually the last 10 years and find the top 25 names each year.
Hi Manish,
The quick way would be to use the YEAR() function with offsets to get the yearly closing prices. YEAR()[1] would be last year’s close and YEAR()[2] would be 2023, so for 2024 performance use this:
(YEAR()[1]/YEAR()[2])-1
Change the offset values in the square brackets to get the previous years. The problem with this is that next year the offsets will change, so the example above would then show the value for 2025.
The better way would be to use the PERFORMANCE() function and set the required date range, so that the values wouldn’t change on the turn of the year. For example, use this for 2023 performance:
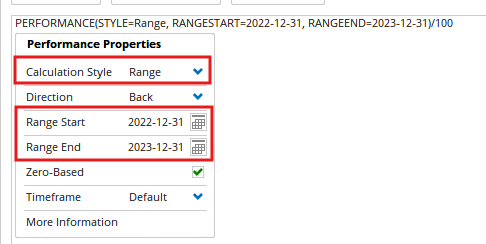
PERFORMANCE(STYLE=Range, RANGESTART=2022-12-31, RANGEEND=2023-12-31)/100
Click the text to select the dates from the calendar icon:
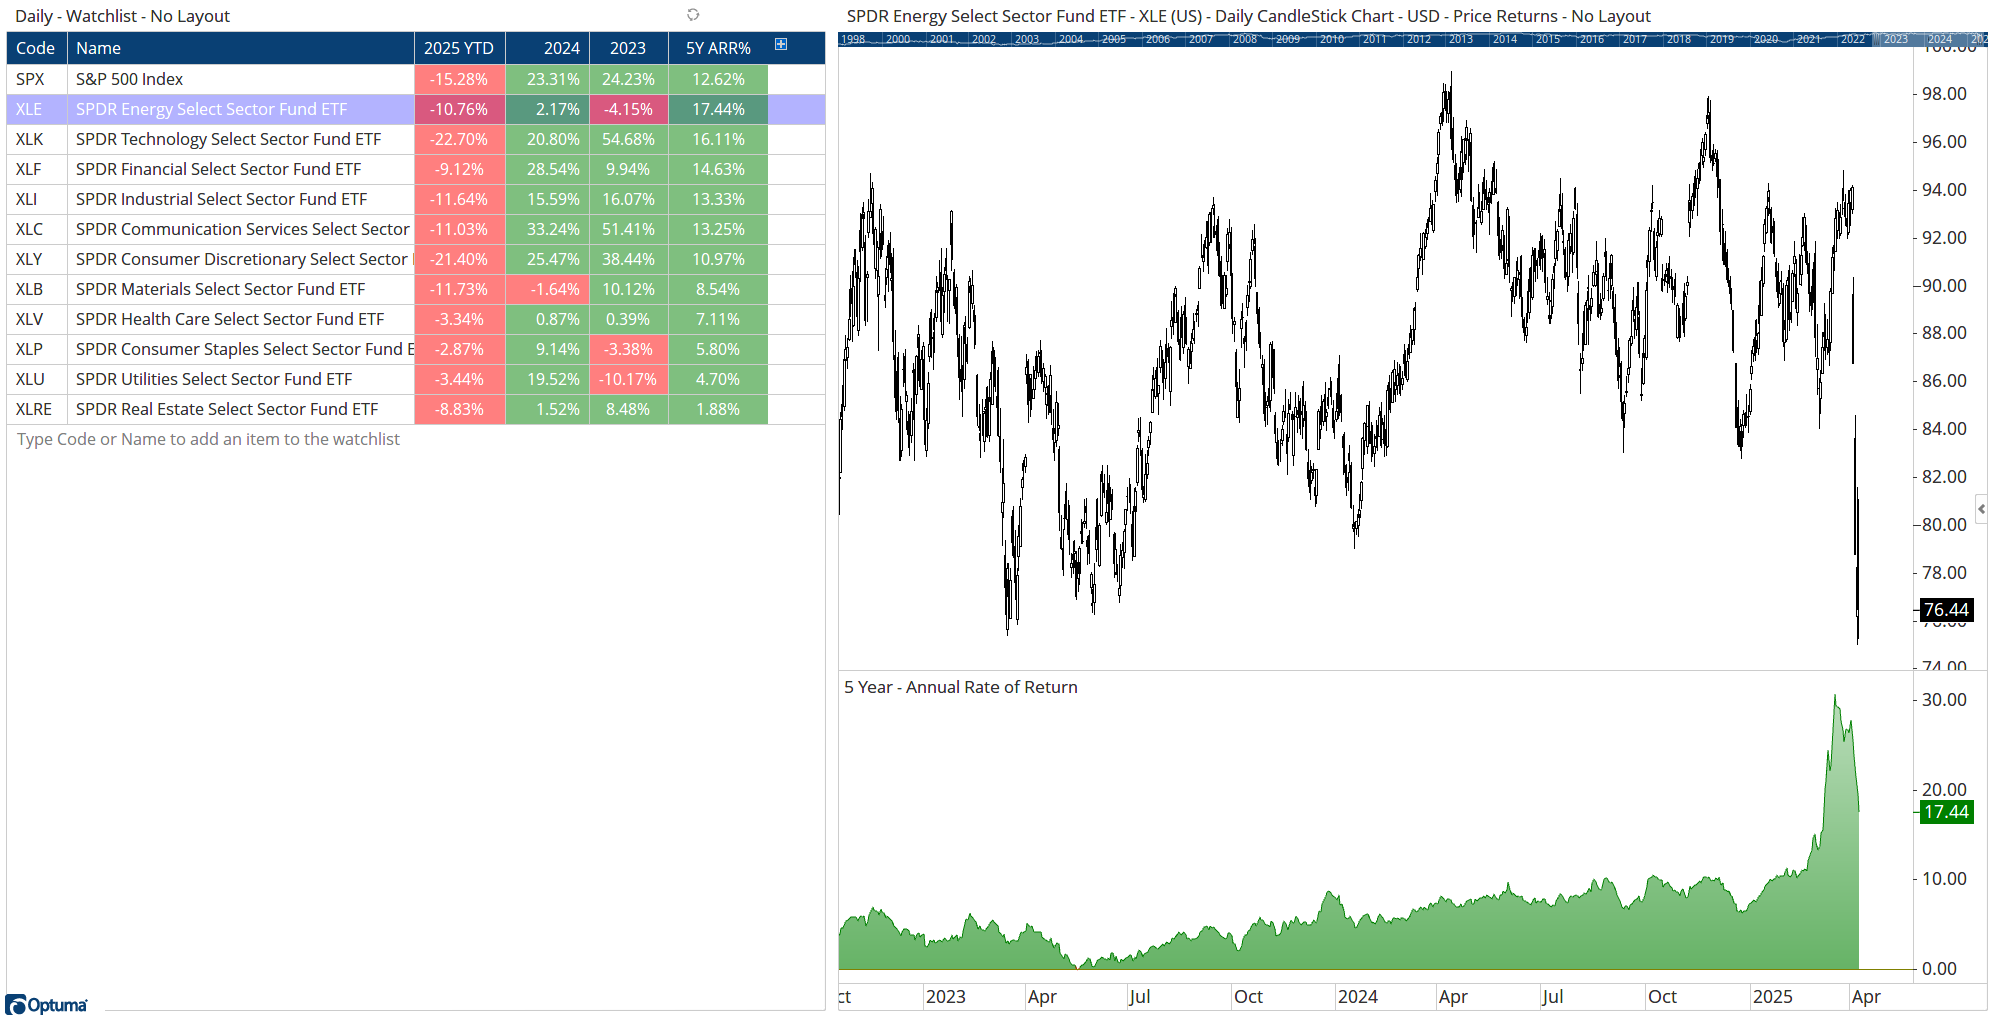
Note that this is divided by 100 so that the Percentage format can be used in the watchlist column. Attached is a workbook with an example of both, along with a column of a 5 year Annual Rate of Return, showing that currently Energy $XLE has averaged +17.44% per year over the last 5 years (since April 8th 2020, not calendar years):
ARR(PERIODAMT=5)/100
Annual Performance.owb (33.3 KB)
1 Like