Hi There.
For the life of me I cannot seem to get a good graph of the US treasury bonds. Which has any meaningful data or time history.
Such as the $UST10Y or the $UST1Y
I’d like to build a US YIELD CURVE chart and have as much history or data as possible.
Thanks for anyones help.
https://www.cnbc.com/quotes/?symbol=US10Y
Okay, may have resolved.
Just had wrong data set perhaps.
Awesome.
DEJHMA8
(Darren Hawkins)
3
Hi Jonathan,
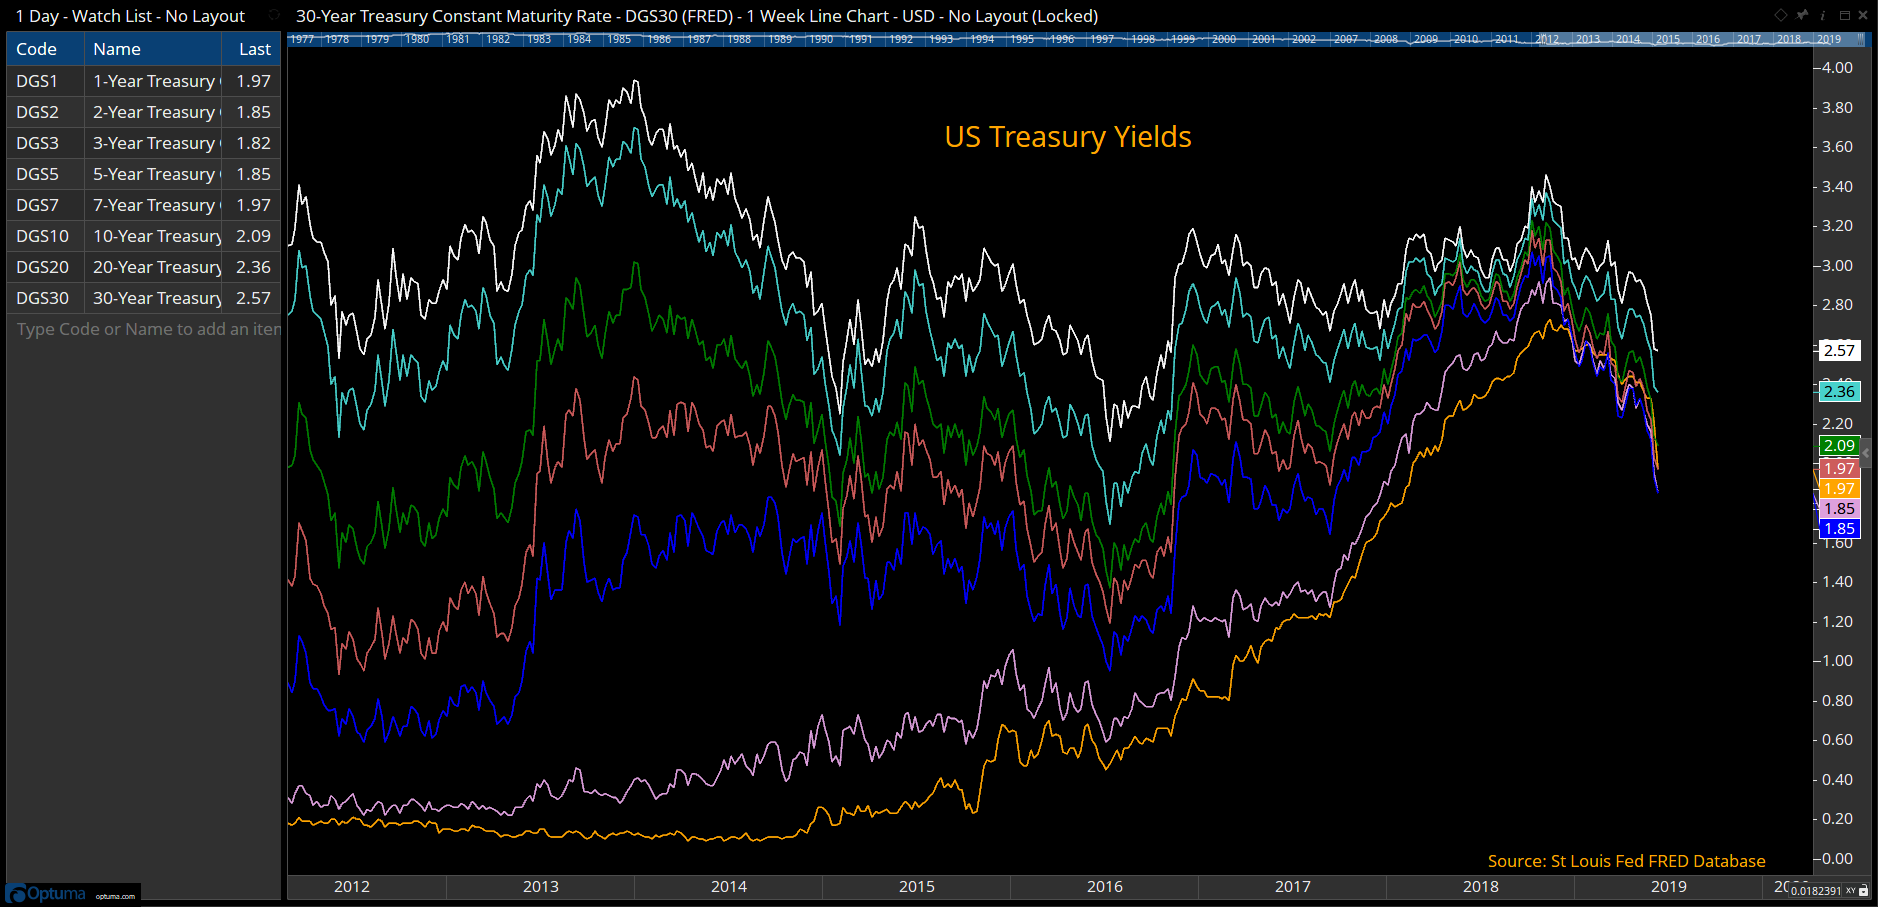
For the US data you can use the data from the FRED Federal Reserve database, eg DGS30 for the 30 year, or T10Y2Y for the 10-2 spread:
Using the FRED Database
Save and open the attached workbook file to open this chart:
FRED-US-Yields.owb (64.7 KB)