Hi Kim,
Apologies for not getting back to you sooner, but here is a revised version of your script. I've commented out the parts of your script and added my changes in bold italics so you can see what I've done.
// Kim #51395 20190303
//Volume Between Swings
//PSW = PERCENTSWING(PERCENT=5.0, DEFAULT=SwingEnd, COLOURSTYLE=Up/Down);
PSW = PERCENTSWING(PERCENT=10, DEFAULT=SwingList, COLOURSTYLE=Up/Down);
PSWStart= SWINGSTART(PSW);
//PSWEnd = SWINGEND(PSWEnd);
PSWEnd = SWINGEND(PSW);
Rng = PSWStart - PSWEnd;
// Down Swings bars
//Sig1 = if((TIMESINCESIGNAL(PSW) > 0 and Rng > 0) , 1, 0);
Sig1 = if((TIMESINCESIGNAL(PSWStart) > 0 and Rng > 0) , 1, 0);
//Sig2 = IF(TIMESINCESIGNAL(PSWEnd) < 1 and Rng < 0, 1, 0) ;
Sig2 = IF(TIMESINCESIGNAL(PSWStart) > 0 and Rng < 0, -1, 0) ;
//Sig3= If(Sig1 or Sig2, 1, 0);
// Up Swing Bars
//Sig4 = if((TIMESINCESIGNAL(PSW) > 0 and Rng < 0), 1, 0);
//Sig5= IF(TIMESINCESIGNAL(PSWEnd) < 1 and Rng > 0, 1, 0) ;
//Sig6= If(Sig4 or Sig5, 1, 0);
// Plot the Down trend Volume
//Plot1 = If(Sig3, ACCSINCESIGNAL(Vol(), Sig1), 0) ;
Plot1 = If(Sig1, ACCSINCESIGNAL(Vol(), Sig1), 0) ;
Plot1.Colour = Red;
Plot1.Plotstyle = Histogram;
Plot1.LineWidth = 5;
Plot1.LineStyle = Solid;
// Plot the Up trend Volume
//Plot2 = If(Sig6, ACCSINCESIGNAL(Vol(), Sig4), 0) ;
Plot2 = If(Sig2, ACCSINCESIGNAL(Vol(), Sig2), 0) ;
Plot2.Colour = Green; Plot2.Plotstyle = Histogram;
Plot2.LineWidth = 5;
Plot2.LineStyle = Solid;
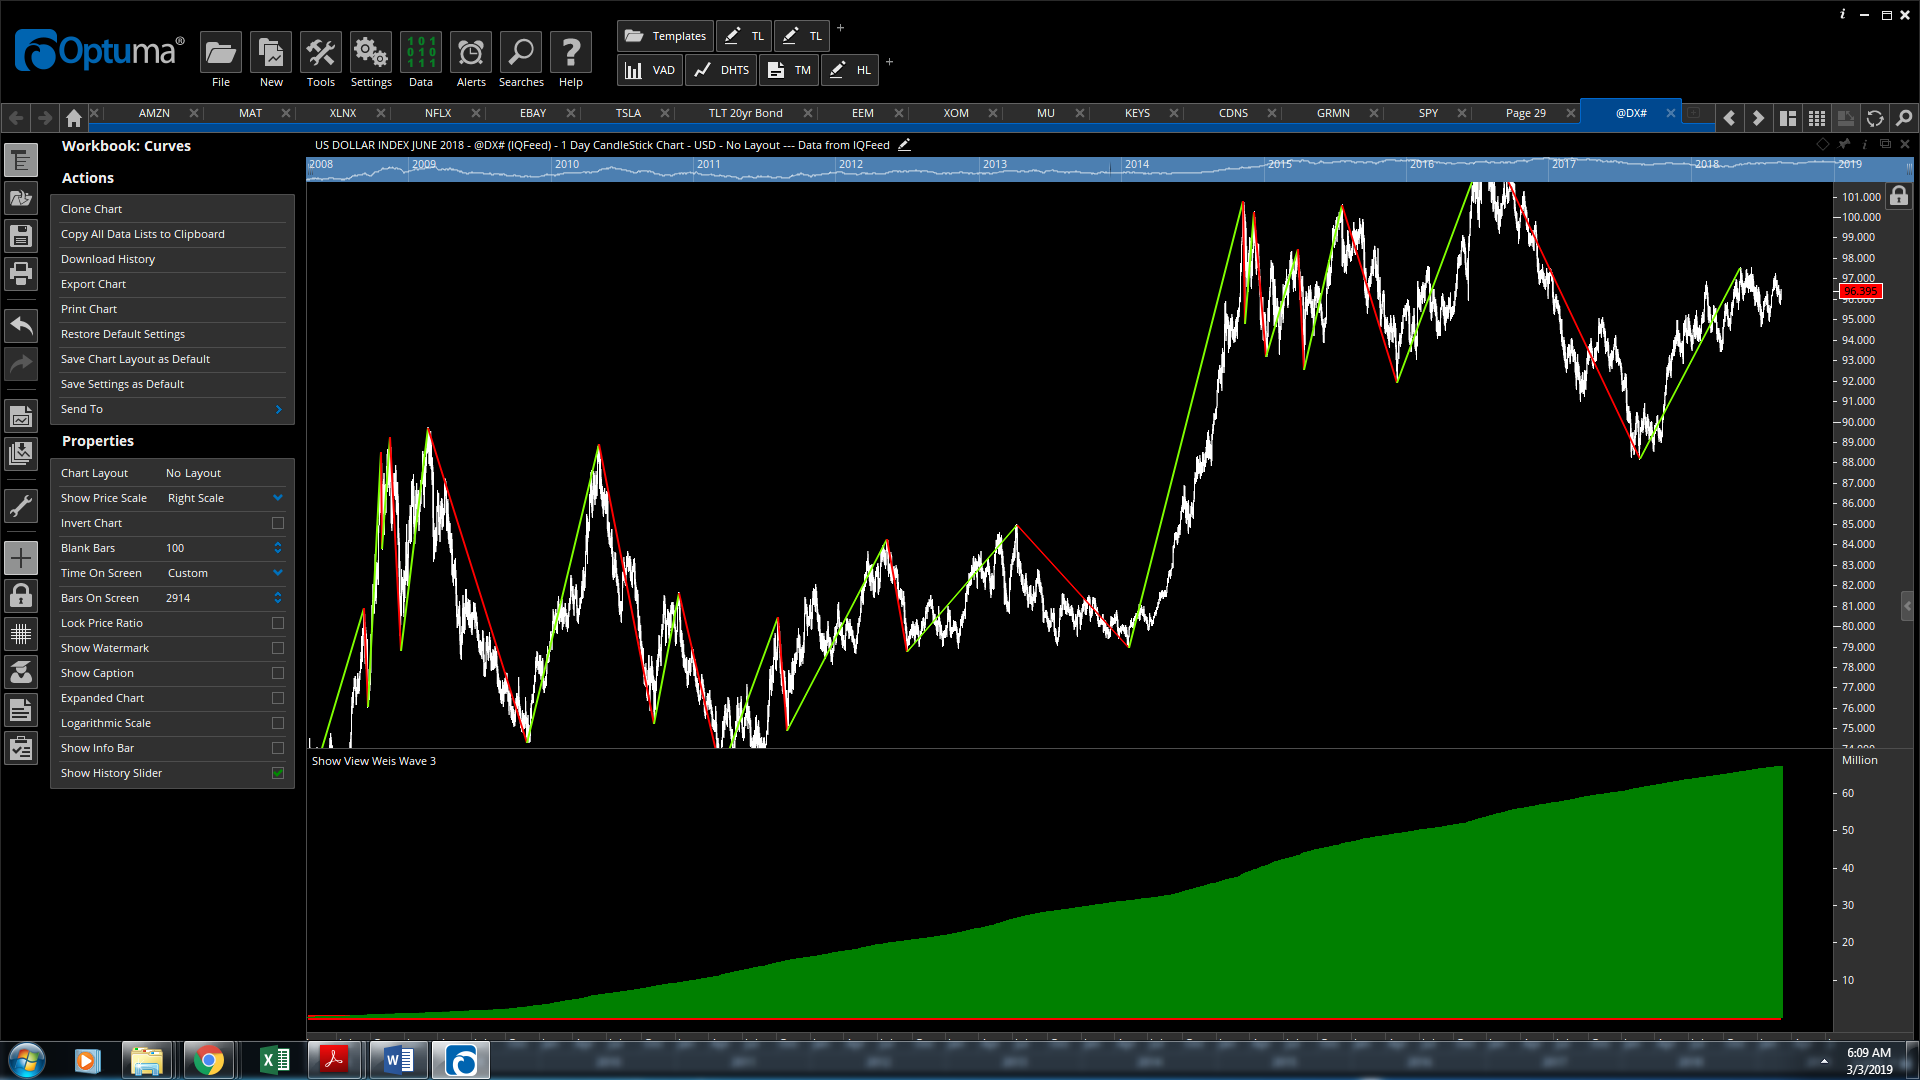
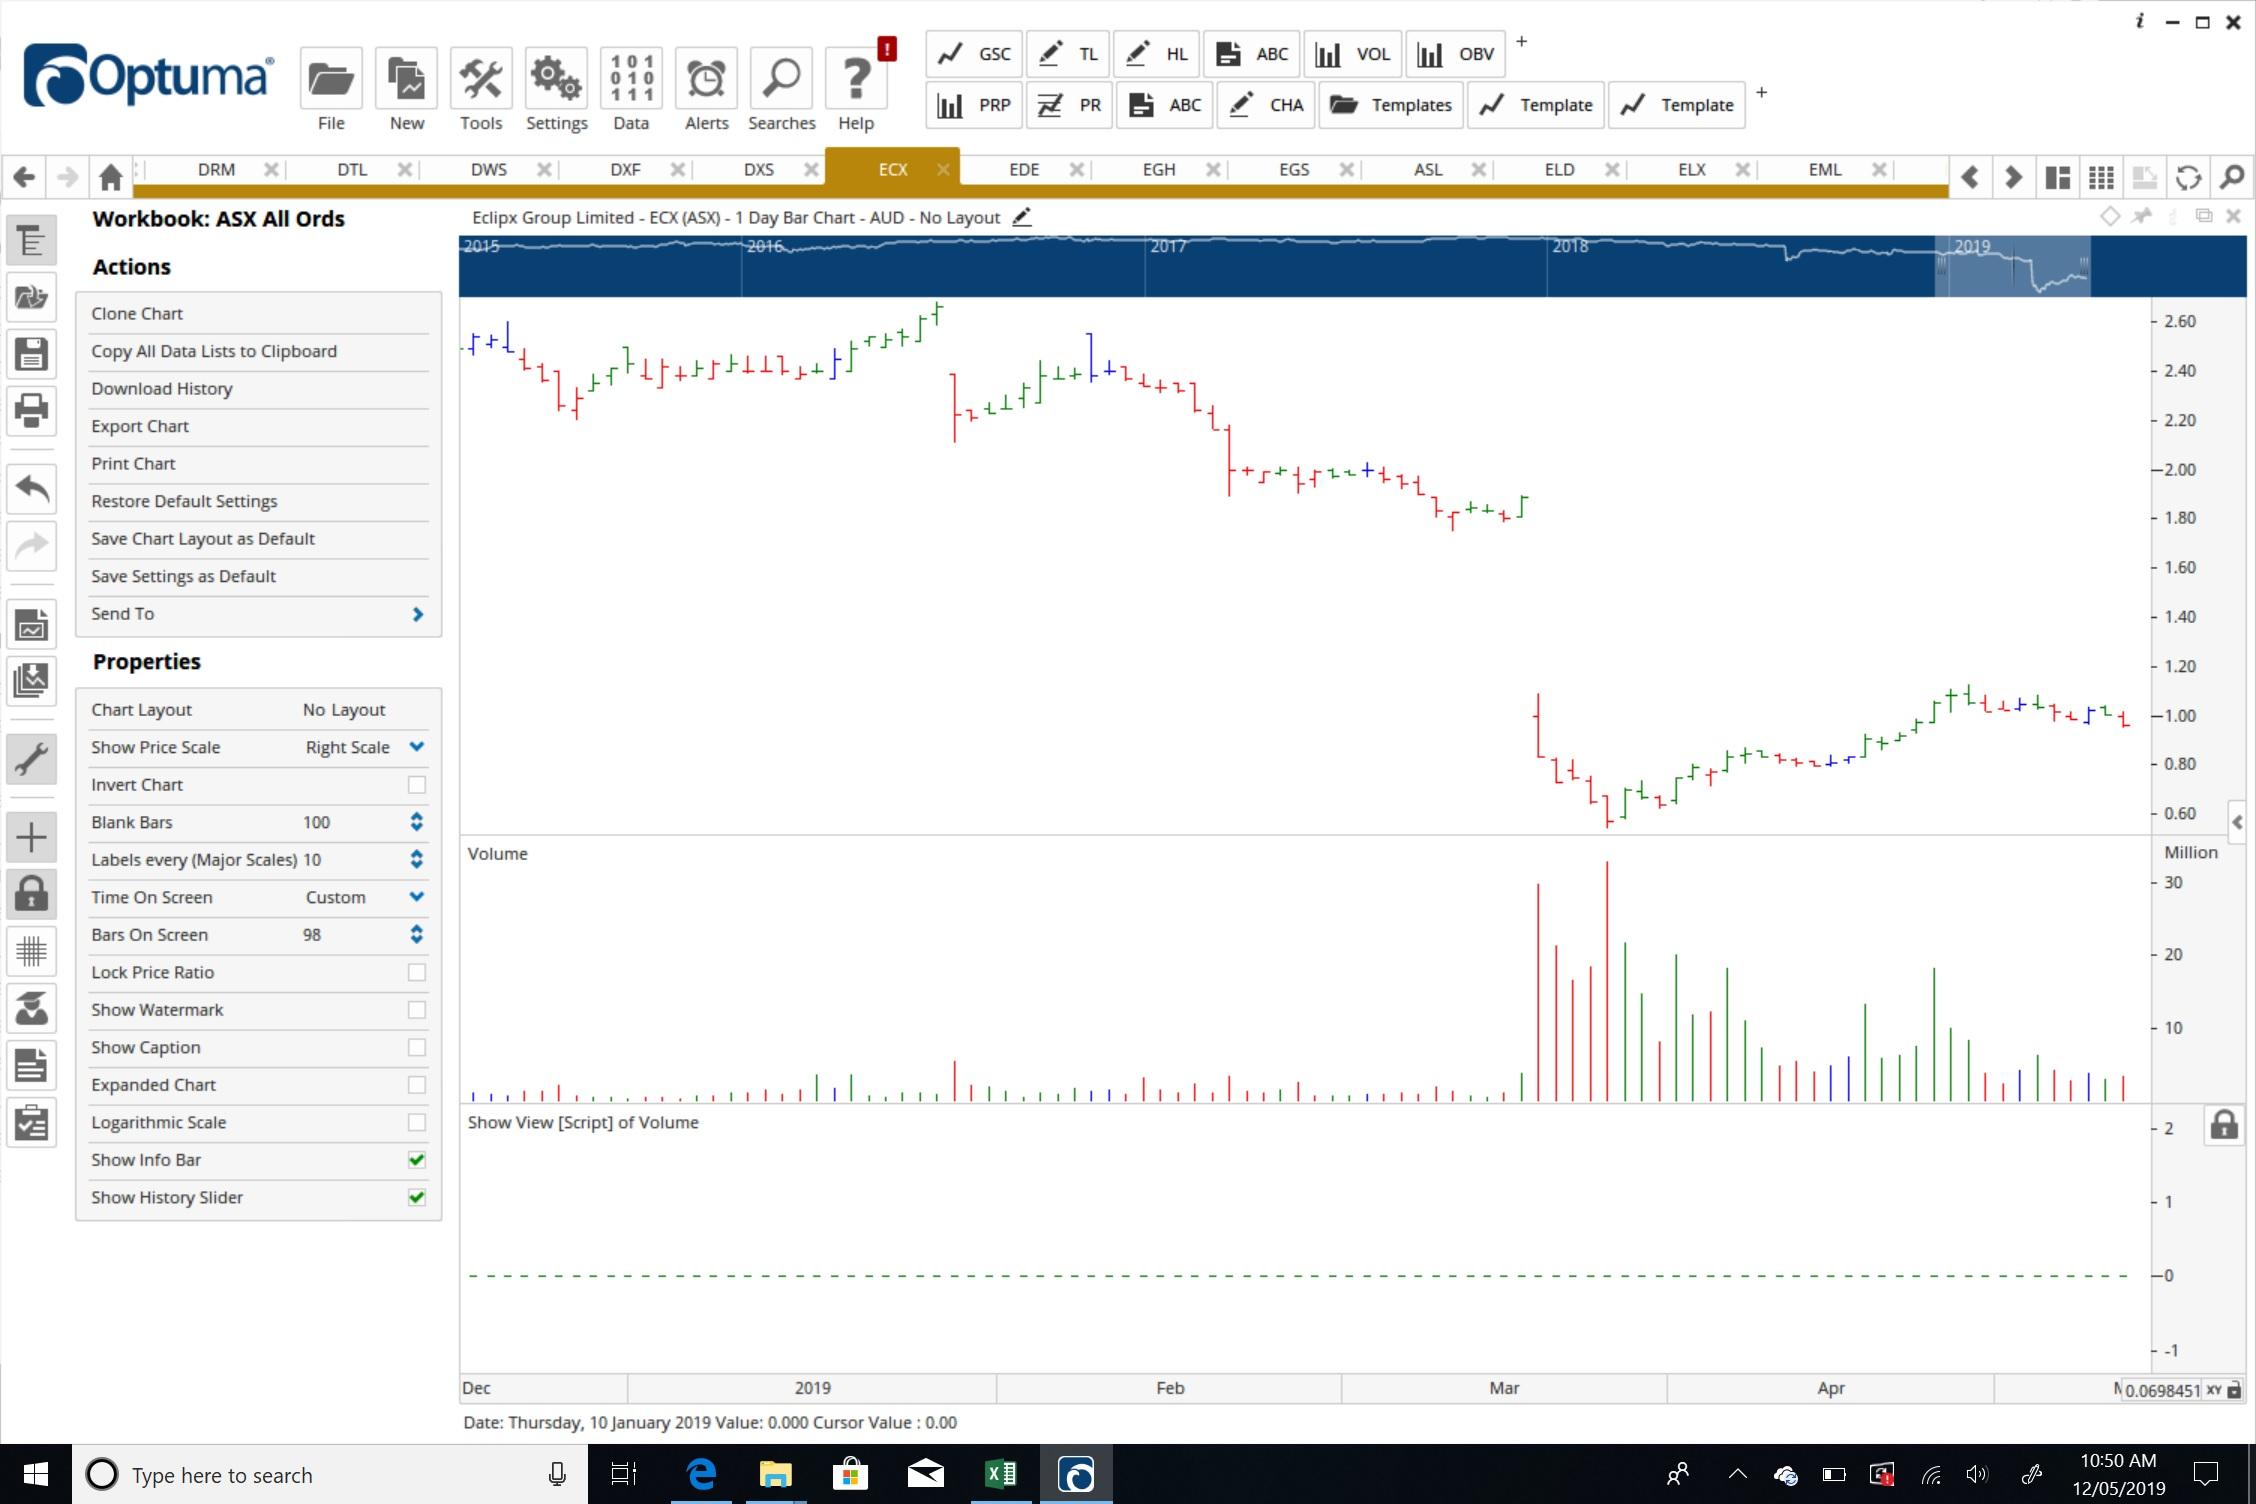
Here what the resulting plot looks like (with PercentSwing = 10%): 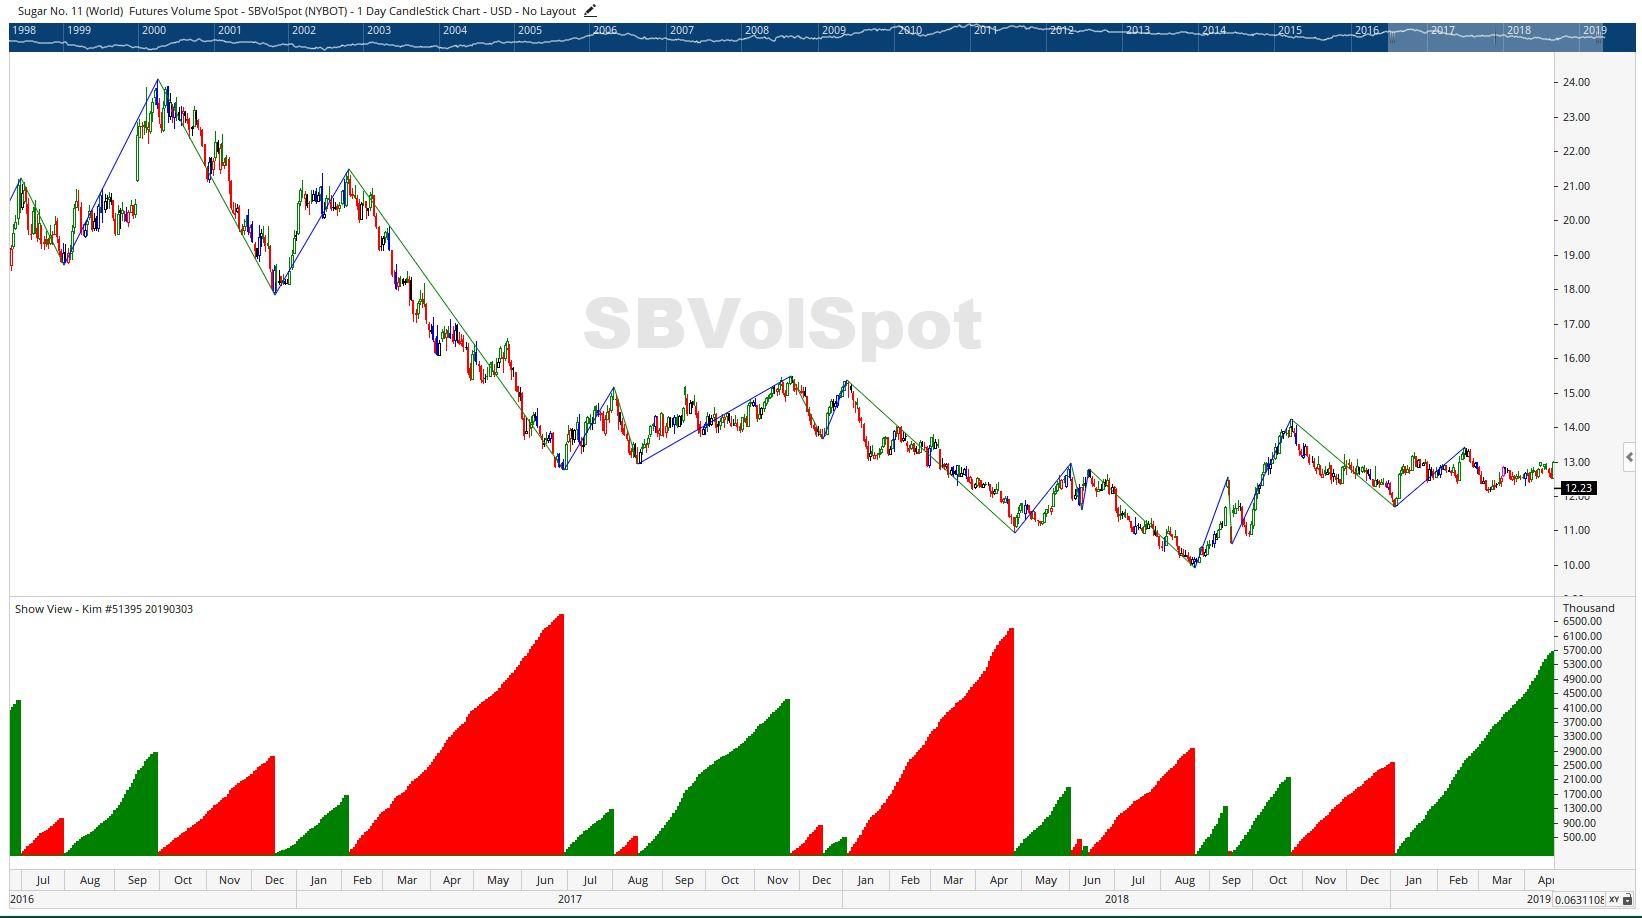
Is this the result you are after?
Cheers
Trevor
The Auld Tyma from

 Here’s the script: