As per this Twitter chart: https://twitter.com/Optuma/status/1689085580372836352?s=20
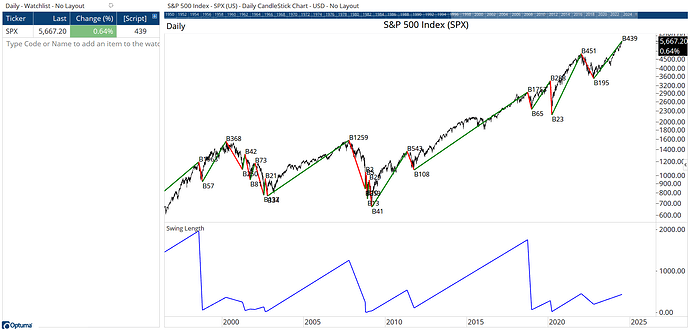
To count the bars since the last swing high or low can be tricky as we only know the swing values when they have been confirmed, so when a swing hasn’t been confirmed we need to use a trick to convert SwingList data to BarList (see Mathew’s post here for a dive in to SwingLists and BarLists).
Also, with swings - whether Gann, Percent, or Volatility - the direction of the current swing is important so we know whether to count from a high or low. This will count from the previous confirmed swing high or low:
//Setup Swing parameters;
S1 = PERCENTSWING(PERCENT=10.0);
//Get swing direction and convert SwingList to BarList;
Up1 = SWINGUP(S1) and CLOSE()>0;
//Get Swing values and timecounts;
SwingHi=TimesinceSignal(HIGH()==SwingEnd(S1));
SwingLo=TimeSinceSignal(LOW()==SwingEnd(S1));
//Display values depending on swing direction;
IF(Up1, SwingHi, SwingLo)
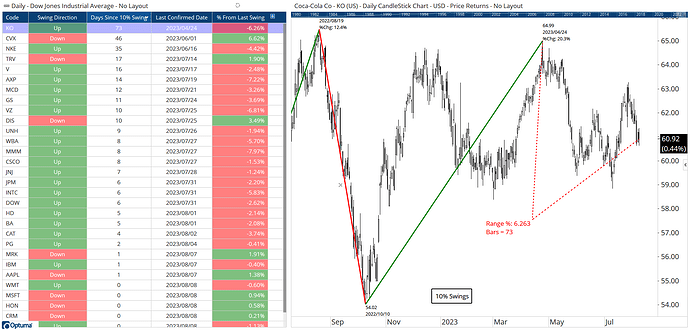
In the example below, $KO has not moved more than 10% from the most recent swing high of $64.99 in 73 days, or since April 24th, and is currently 6.26% below that high. $CVX is currently in a downswing, so the timecount is 46 days from the last swing low, and is currently trading at 6.6% above (or 3.4% below the level required to turn the swing upward.
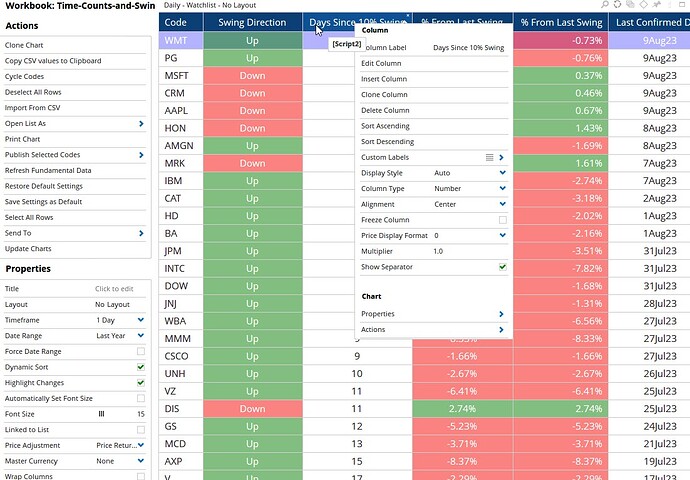
Workbook attached.
Time-Counts-and-Swings.owb (36.4 KB)


