This thread is for charts posted on twitter.com/Optuma
Bitcoin ETFs Assets under Management and monthly fund flows (requires access to US Fundamental data): https://x.com/Optuma/status/1765241697691181365?s=20
The attached workbook has been modified as not all clients have access to the column charts, and shows the AUM and Fund Flows below the price chart (green is higher than previous, red is lower).
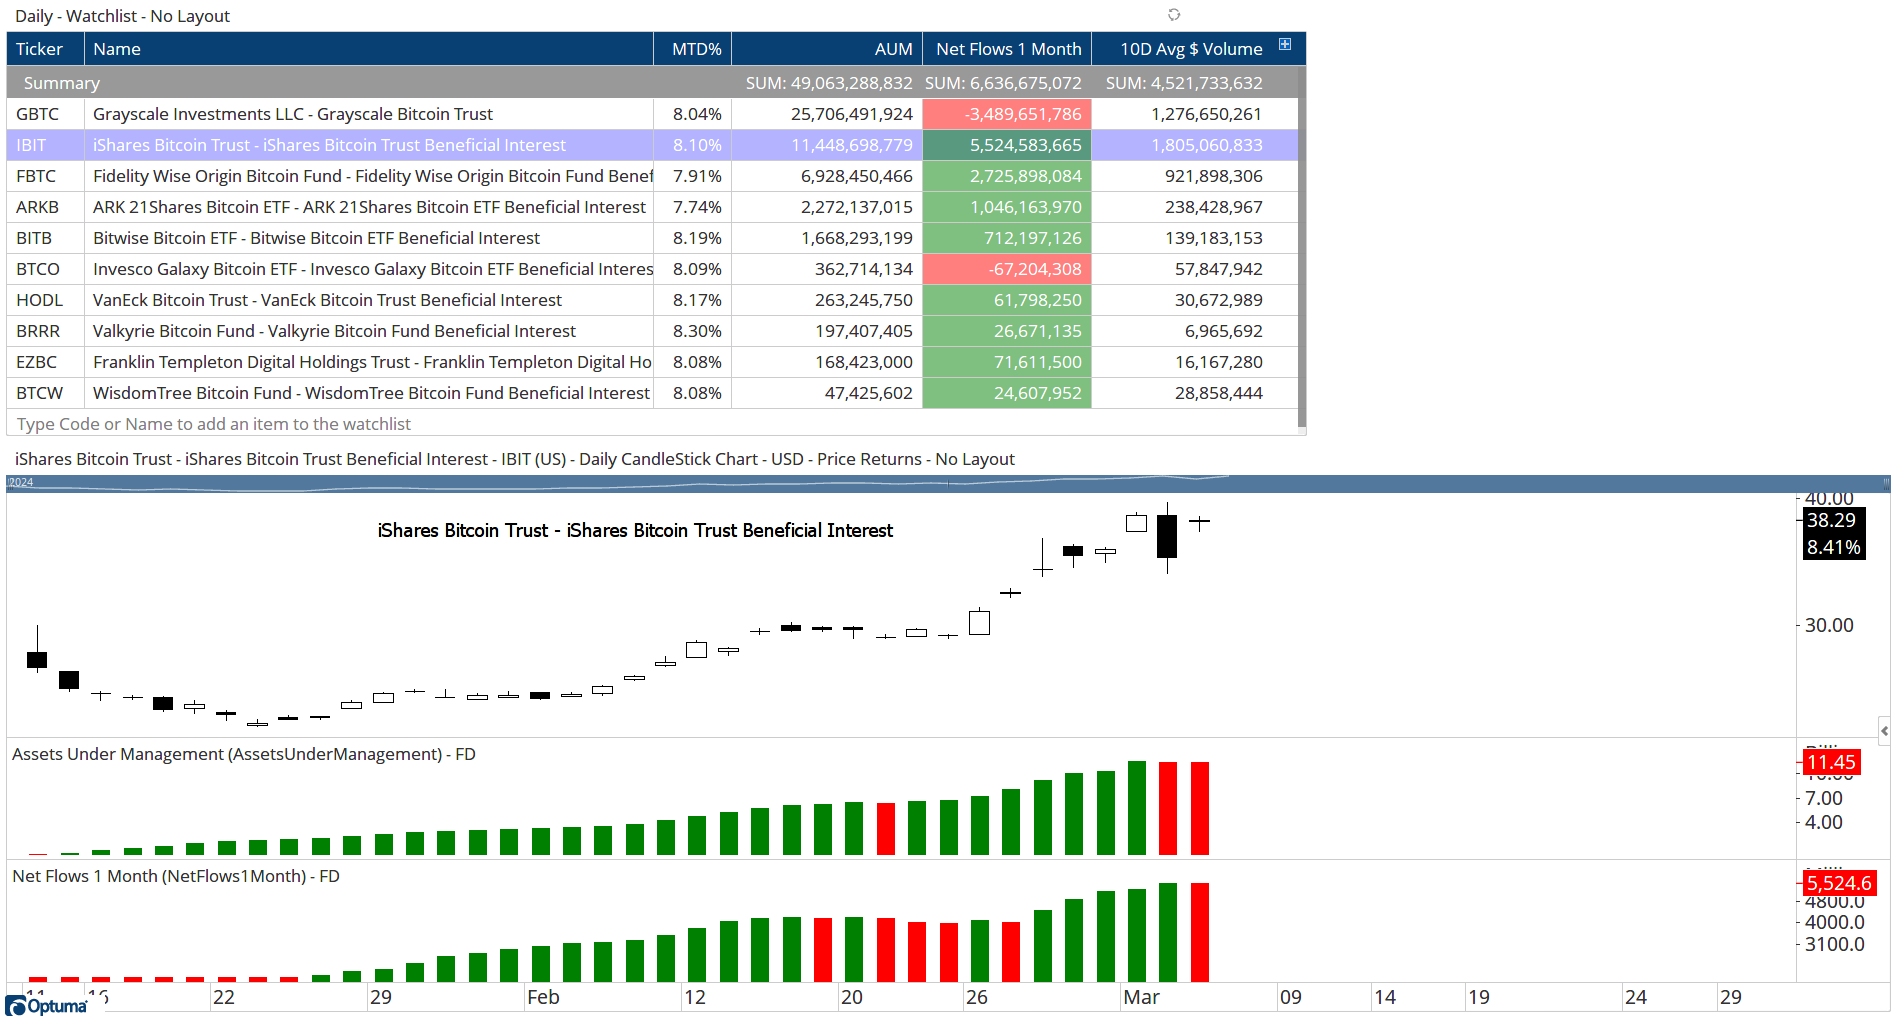
BTC ETFs.owb (31.1 KB)
Hello, Darren
how are you doing?
I saw you tweet: https://x.com/Optuma/status/1770576390116737523?s=20
Could you share your workbook with us, please?
Best,
Thank you.
RF.
Hey Rafi,
See attached for the US ETFs (it was built using the script formulas found here).
Closing highs by calendar year.owb (38.4 KB)
1 Like
Thank you very much!
best
RF
1 Like
Hi Darren,
I saw today that you updated this wookbook, am i right?
Would you share it with us?
https://x.com/Optuma/status/1772587804419088600?s=20
thank you.
RF
Hey Rafi,
Yes I added a column chart for the YTD Net Fund Flows - see attached.
BTC ETF Fund Flows.owb (21.4 KB)
Hi Darren,
You have published again your chart about how many SPX members beat the index on Twitter (https://twitter.com/Optuma/status/1773137003535564974).
I have recreated this chart some time ago using your forum post (Twitter Charts).
Unfortunately, my chart looks different than yours on Twitter.
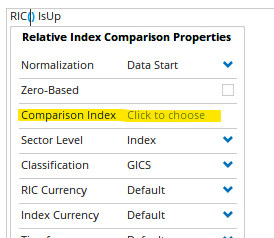
Here is my script for the outperforming:
RIC() IsUp
Here are my settings for the Breadth engine:
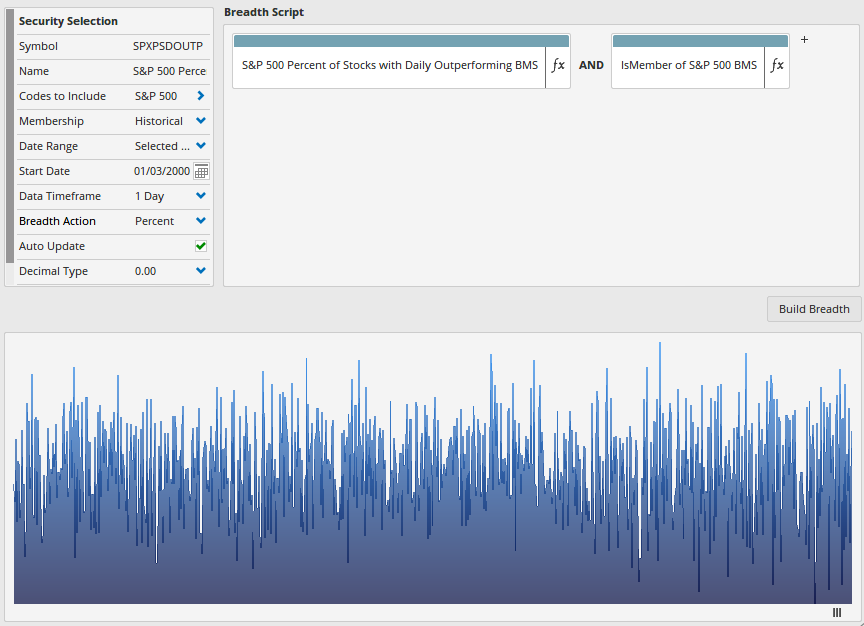
Here is my script for “< 33% outperforming”:
Line1 = GETDATA(CODE=SPXPSDOUTP:Market Breadth) ;
// Less than 33.33% outperforming on positive SPX Days
Line2 = Line1 < 33.33 and CLOSE() IsUp ;
Line2
Here is my chart:
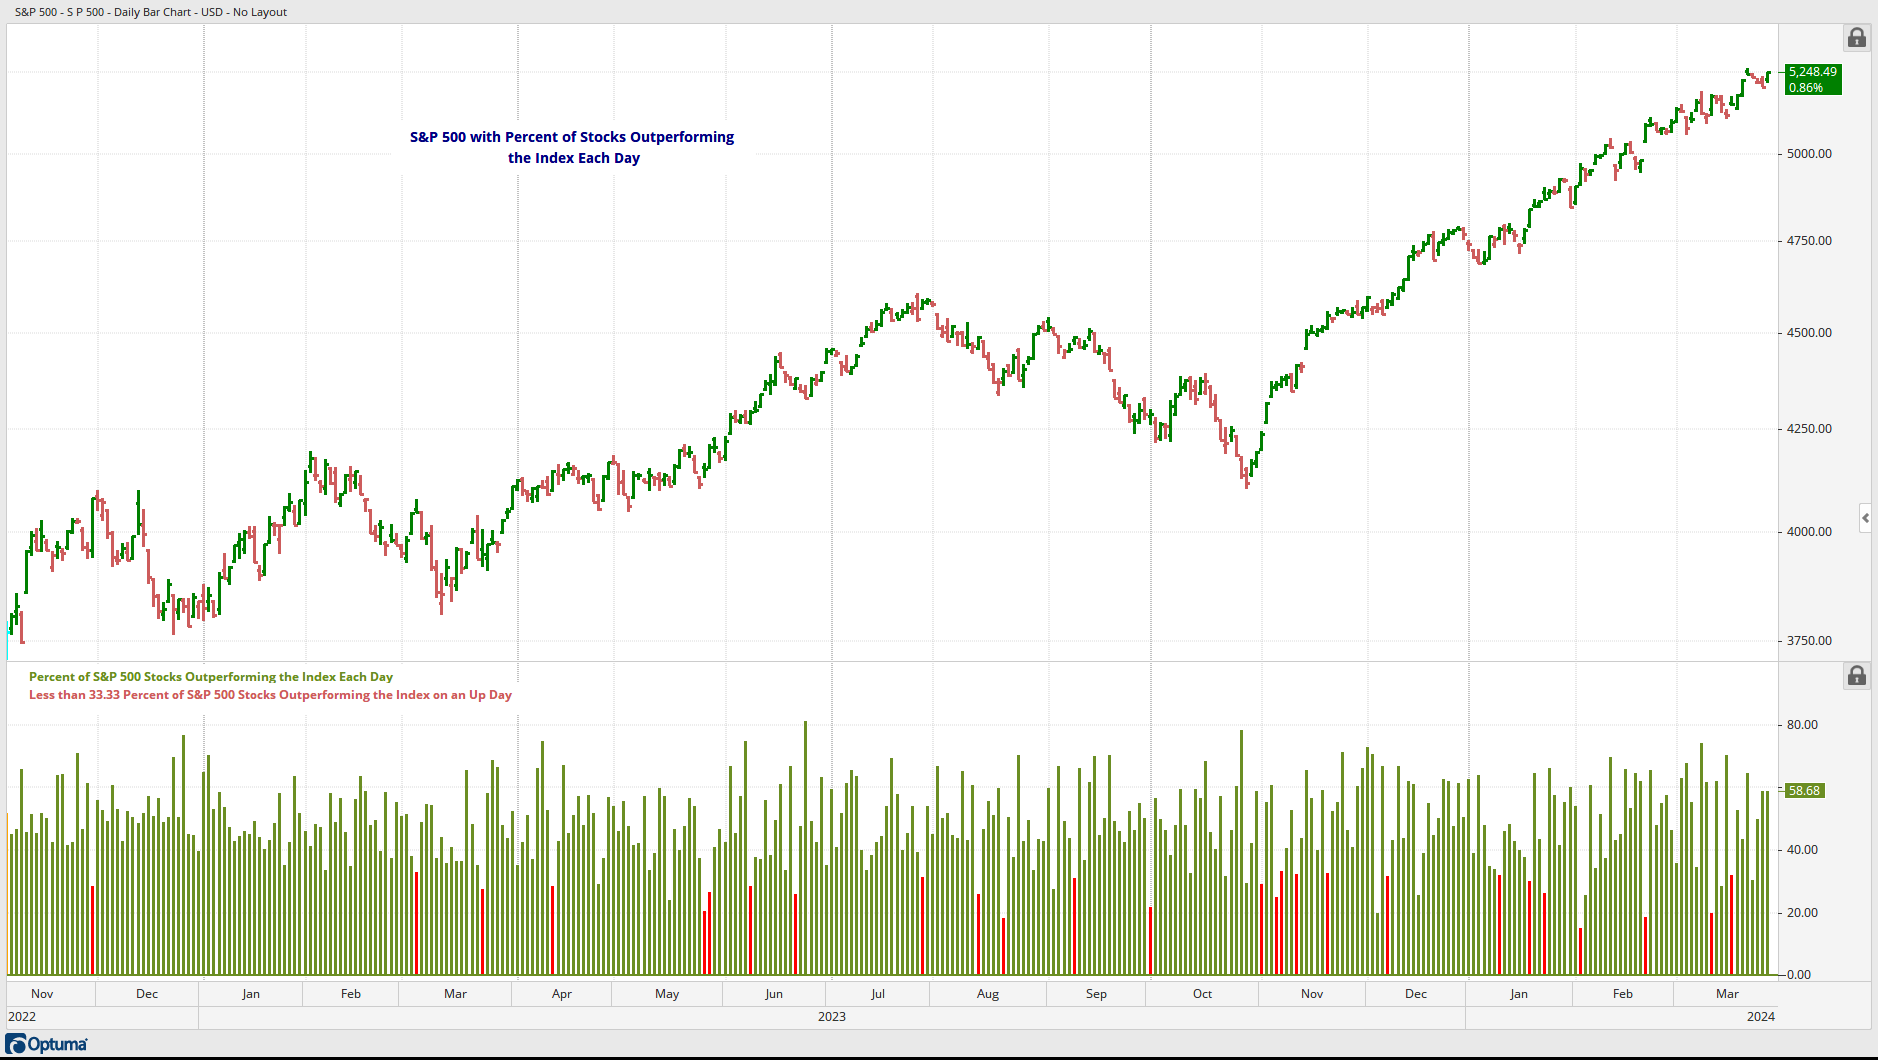
Inform me please why my chart is different than yours. My data for the “US Equity” database is up-to-date. I have 22798 items in the folder.
Thank you very much.
Thomas
Hi Thomas,
Not sure, but is your S&P500 chart using our data? The header looks like it’s imported, so it could be the RIC() function is not using the correct comparitive price data. Also, there’s no need to use the IsMember condition in a scan any more if the Historical Membership has been delected.
When left blank the RIC defaults to our SPX data in World Indices, but if you are not using that data then you have to tell it which data to use:
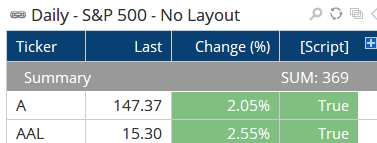
Also, you can open a watchlist of the S&P500 symbols and add the RIC() IsUp column, and then sum the true values in the Summary row. I get 369/503 for Wednesday (73%).
If that doesn’t work then please contact support.
Hello Darren,
Thanks for your reply.
I think I solved the problem by deleting the “IsMember” addition from the formula in the Breadth engine.
Now my chart looks exactly like yours.
Thank you very much for your suggestion.
Thomas
Hi Darren,
You published on X ( x.com ) the following chart:
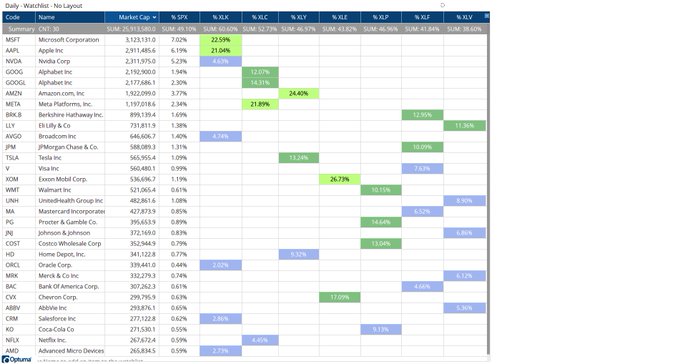
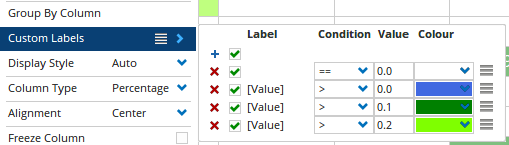
Can you please show me how you have colored the percentage values in the watchlist?
I have tried some settings in the property “Custom Labels” but was not successful.
Many thanks,
Thomas
Hi Thomas,
The values have to be from lowest to highest in the Custom Labels, and because they are displayed as percentages in the watchlist above 10% in dark green is > 0.1, and light green > 0.2 for more than 20%:
Hi Darren,
Thank you very much. Easy again, BUT the special issue is the order from lowest to highest.
Best wishes,
Thomas
1 Like
Hi,
Is it possible to share workbook that is in this post where are Russell 3000 highs-lows in different time frames.
Regards, Pentti
Hi Pentti,
It was created by subtracting the new lows from the new highs from our US Breadth data.
For the net 1 month highs for the Russell 3000 in the Show View:
GETDATA(CODE=R3K-N1MH.OB:BD) - GETDATA(CODE=R3K-N1ML.OB:BD)
Workbook attached.
R3K New HighsLows.owb (37.8 KB)
Hi,
Thanks! I tried to do this in a different way but I didn’t get it working ok.
(CLOSE() > HIGHESTHIGH(BARS=21, BACKTYPE=Days)) - (CLOSE() < LOWESTLOW(BARS=21, BACKTYPE=Days))
Regards, Pentti
Hi Darren,
You published on X (x.com) the following chart:
Can you please publish the workbook with all the scripts of this chart here in the forum?
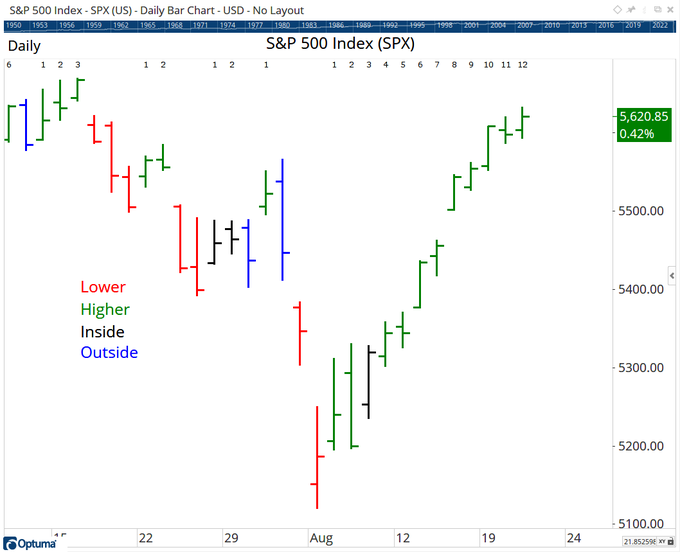
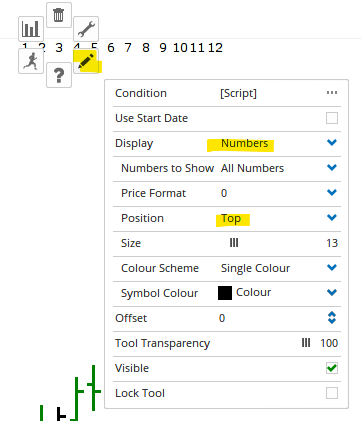
Of special interest for me is how you placed the counting numbers at the top of the chart.
As always thank you very much for your great ideas, inspiring insights, and of course your help.
Thanks
Thomas
Hi Thomas,
Here’s the script to count how long it has been since the condition was false, ie neither an inside or higher bar using the BarTypes function:
V1=BARTYPES().Inside or BARTYPES().Higher;
TIMESINCESIGNAL(V1==0)
In the Show Bar set the Display to Numbers, with position at the top:
1 Like
Hi Darren,
You published on X (x.com ) the following analysis about the 1st Fed rate cut:
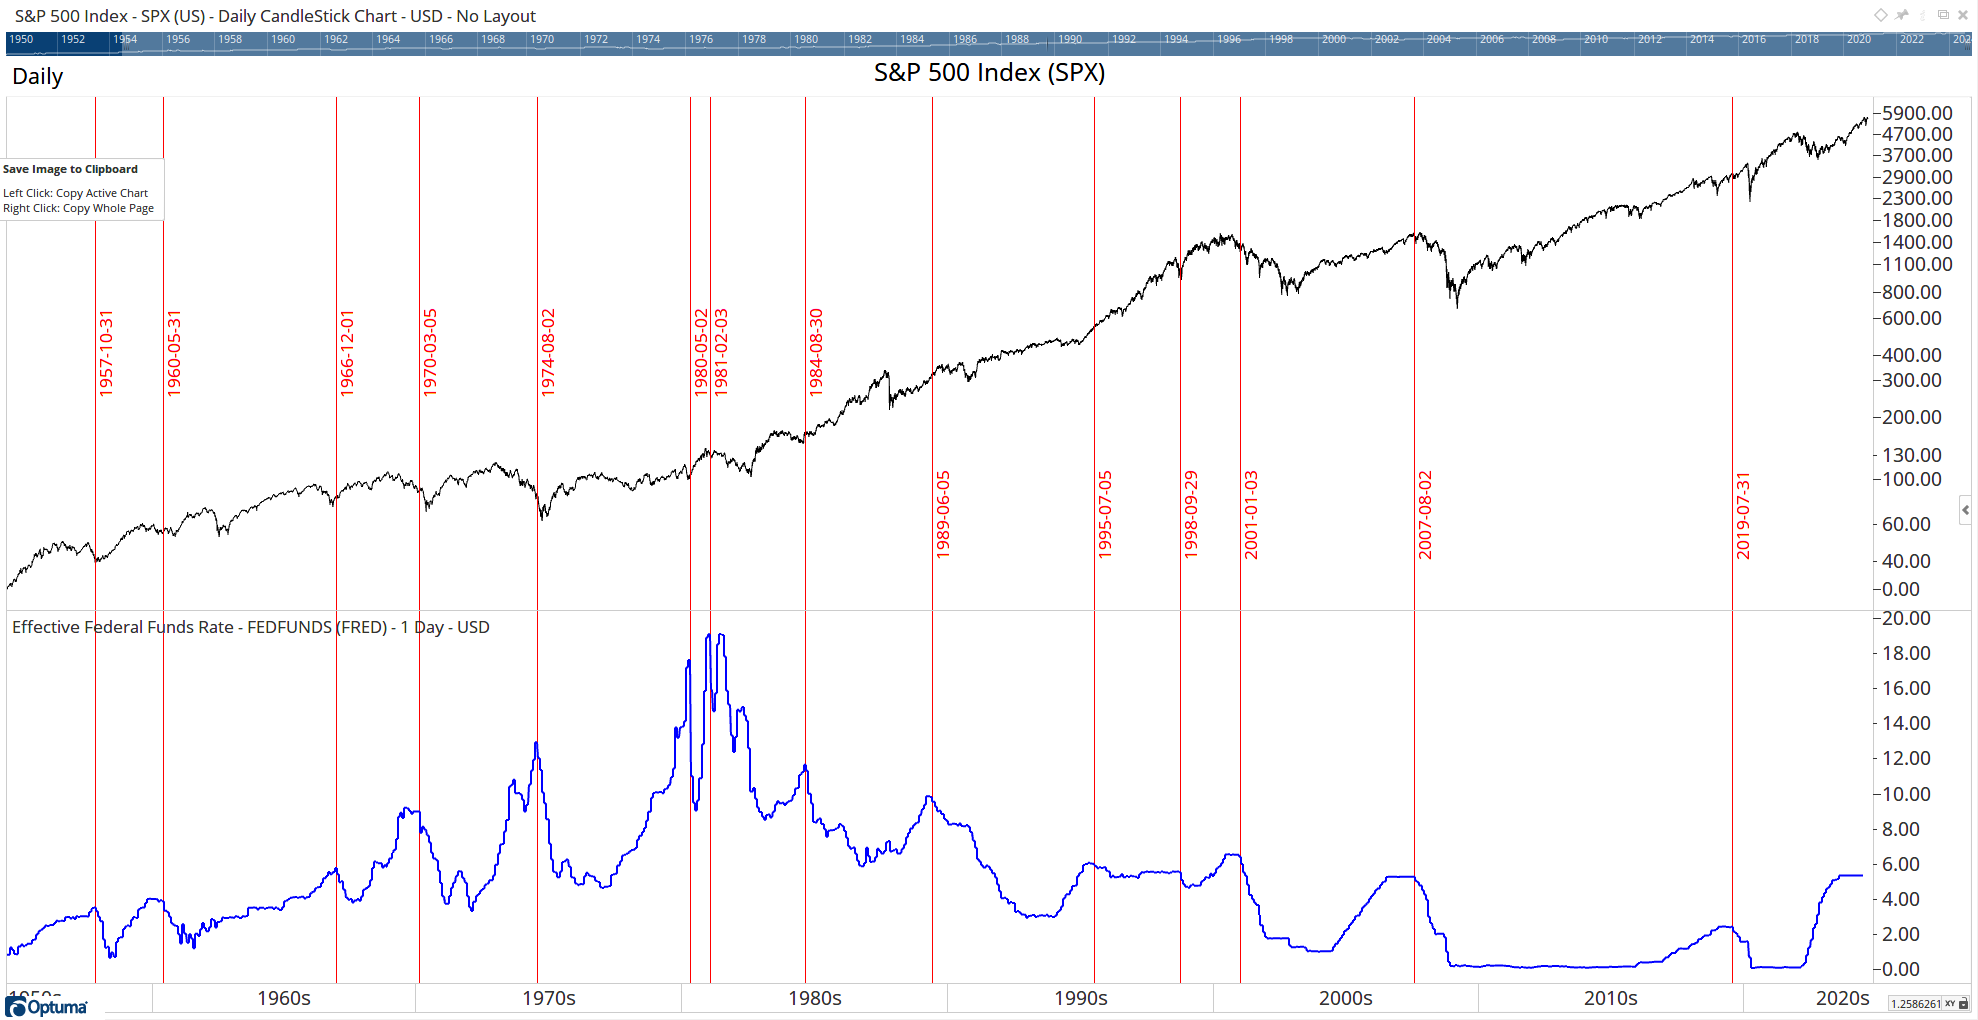
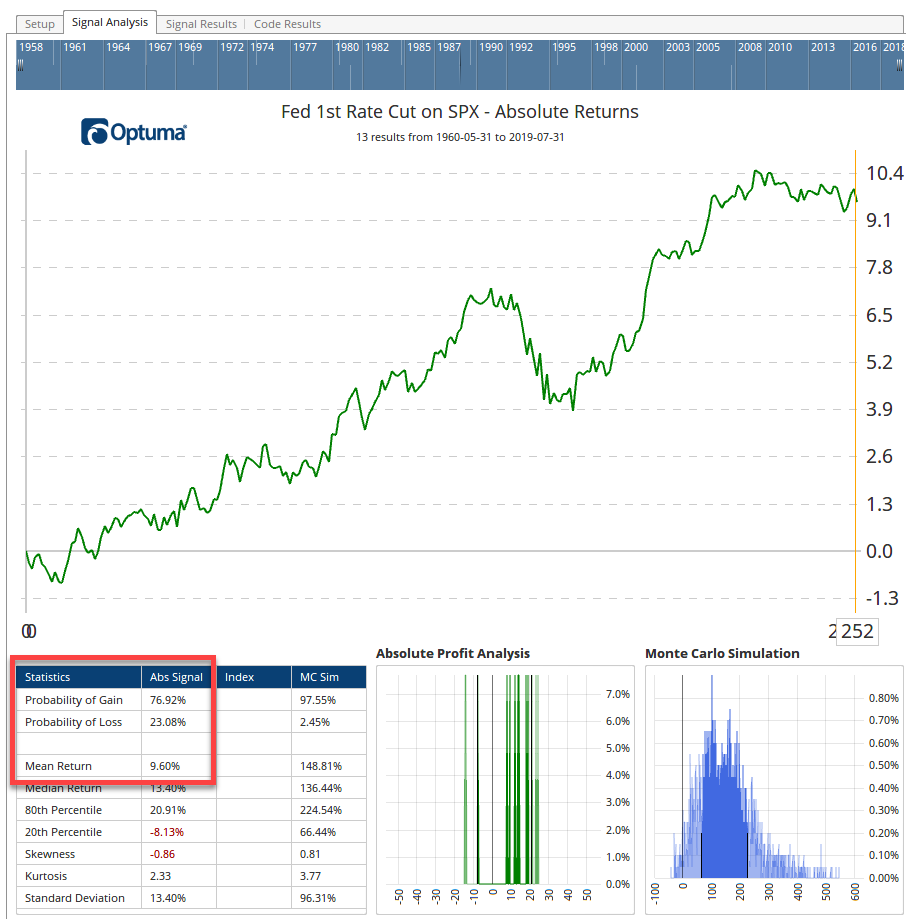
Can you please publish here in the forum the script for the test?
Thanks,
Thomas
Hi Thomas,
I drew vertical lines when the Effective Federal Funds Rate was cut, and hardcoded the dates in the Signal Tester:
BARDATE()==STRDATE(DATE=1957-10-31) or
BARDATE()==STRDATE(DATE=1960-05-31) or
BARDATE()==STRDATE(DATE=1966-12-01) or
BARDATE()==STRDATE(DATE=1970-03-05) or
BARDATE()==STRDATE(DATE=1974-08-02) or
BARDATE()==STRDATE(DATE=1980-05-02) or
BARDATE()==STRDATE(DATE=1981-02-03) or
BARDATE()==STRDATE(DATE=1984-08-30) or
BARDATE()==STRDATE(DATE=1989-06-05) or
BARDATE()==STRDATE(DATE=1995-07-05) or
BARDATE()==STRDATE(DATE=1998-09-29) or
BARDATE()==STRDATE(DATE=2001-01-03) or
BARDATE()==STRDATE(DATE=2007-08-02) or
BARDATE()==STRDATE(DATE=2019-07-31)
This workbook requires access to the FRED Economic Reserve database.
Fed Rate Cuts.owb (24.4 KB)
1 Like